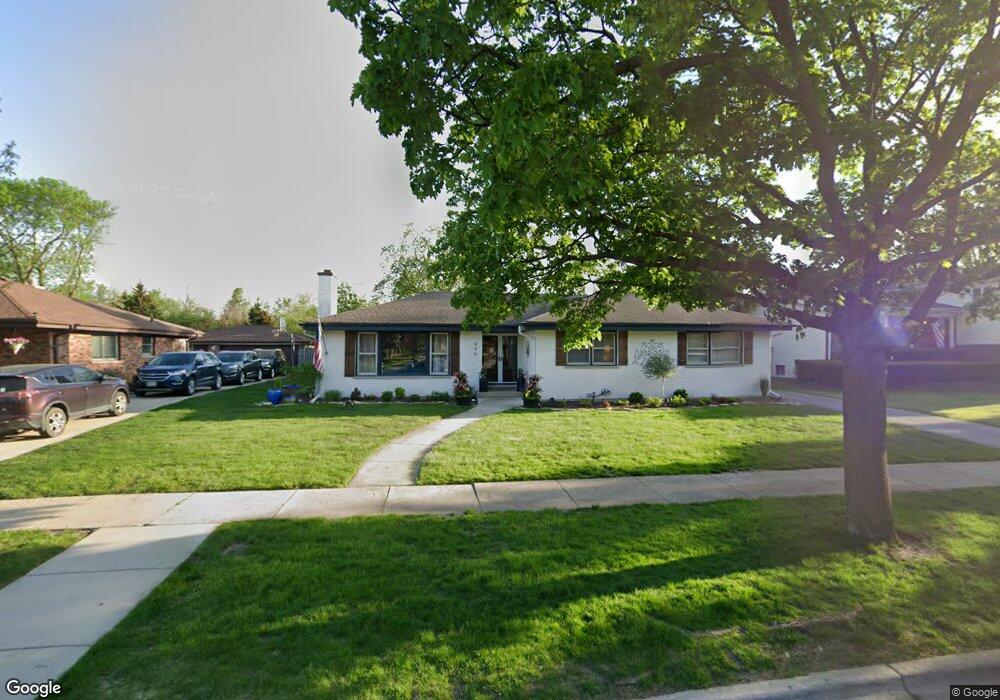
446 E Allison St Elmhurst, IL 60126
Estimated Value: $707,000 - $846,000
3
Beds
2
Baths
2,062
Sq Ft
$372/Sq Ft
Est. Value
About This Home
This home is located at 446 E Allison St, Elmhurst, IL 60126 and is currently estimated at $767,405, approximately $372 per square foot. 446 E Allison St is a home located in DuPage County with nearby schools including Jefferson Elementary School, Sandburg Middle School, and Bryan Middle School.
Ownership History
Date
Name
Owned For
Owner Type
Purchase Details
Closed on
Jun 27, 2017
Sold by
Olson Thomas F and Olson Patrick M
Bought by
Mccomb Lisa M
Current Estimated Value
Home Financials for this Owner
Home Financials are based on the most recent Mortgage that was taken out on this home.
Original Mortgage
$340,000
Outstanding Balance
$175,463
Interest Rate
3.25%
Mortgage Type
New Conventional
Estimated Equity
$591,942
Purchase Details
Closed on
Aug 28, 2002
Sold by
Angelopoulos Pete G and Angelopoulos Mary
Bought by
Olson Patrick M and Olson Thomas F
Home Financials for this Owner
Home Financials are based on the most recent Mortgage that was taken out on this home.
Original Mortgage
$298,000
Interest Rate
6.32%
Mortgage Type
Balloon
Create a Home Valuation Report for This Property
The Home Valuation Report is an in-depth analysis detailing your home's value as well as a comparison with similar homes in the area
Home Values in the Area
Average Home Value in this Area
Purchase History
| Date | Buyer | Sale Price | Title Company |
|---|---|---|---|
| Mccomb Lisa M | $425,000 | Attorneys Title Guaranty Fun | |
| Olson Patrick M | $372,500 | -- |
Source: Public Records
Mortgage History
| Date | Status | Borrower | Loan Amount |
|---|---|---|---|
| Open | Mccomb Lisa M | $340,000 | |
| Previous Owner | Olson Patrick M | $298,000 |
Source: Public Records
Tax History
| Year | Tax Paid | Tax Assessment Tax Assessment Total Assessment is a certain percentage of the fair market value that is determined by local assessors to be the total taxable value of land and additions on the property. | Land | Improvement |
|---|---|---|---|---|
| 2024 | $11,583 | $200,199 | $124,815 | $75,384 |
| 2023 | $10,753 | $185,130 | $115,420 | $69,710 |
| 2022 | $10,427 | $177,960 | $110,950 | $67,010 |
| 2021 | $10,169 | $173,530 | $108,190 | $65,340 |
| 2020 | $9,776 | $169,730 | $105,820 | $63,910 |
| 2019 | $9,570 | $161,370 | $100,610 | $60,760 |
| 2018 | $9,904 | $165,870 | $95,240 | $70,630 |
| 2017 | $9,689 | $158,060 | $90,760 | $67,300 |
| 2016 | $9,486 | $148,900 | $85,500 | $63,400 |
| 2015 | $9,393 | $138,710 | $79,650 | $59,060 |
| 2014 | $10,703 | $144,880 | $63,790 | $81,090 |
| 2013 | $10,585 | $146,920 | $64,690 | $82,230 |
Source: Public Records
Map
Nearby Homes
- 494 E Atwood Ct
- 593 S Edgewood Ave
- 566 S Cedar Ave
- 522 E Park Manor Ct
- 2050 Atwood Ave
- 274 E Crescent Ave
- 515 S Parkview Ave
- 353 E Butterfield Rd
- 788 S Cambridge Ave
- 323 E Butterfield Rd
- 956 S Cadwell Ave
- 837 S Kearsage Ave
- 580 S Kearsage Ave
- 251 E South St
- 160 E Cayuga Ave
- 918 S Cambridge Ave
- 504 N Irving Ave
- 600 N Irving Ave
- 694 S York St
- 250 N Irving Ave
- 452 E Allison St
- 440 E Allison St
- 434 E Allison St
- 458 E Allison St
- 685 S Stratford Ave
- 428 E Allison St
- 462 E Allison St
- 437 E Allison St
- 425 E Barclay Ct
- 459 E Allison St
- 424 E Allison St
- 674 S Stratford Ave
- 423 E Barclay Ct
- 470 E Allison St
- 679 S Stratford Ave
- 675 S Hillcrest Ave
- 427 E Barclay Ct
- 1951 Stratford Ave
- 692 S Edgewood Ave
- 668 S Stratford Ave Unit 2
Your Personal Tour Guide
Ask me questions while you tour the home.