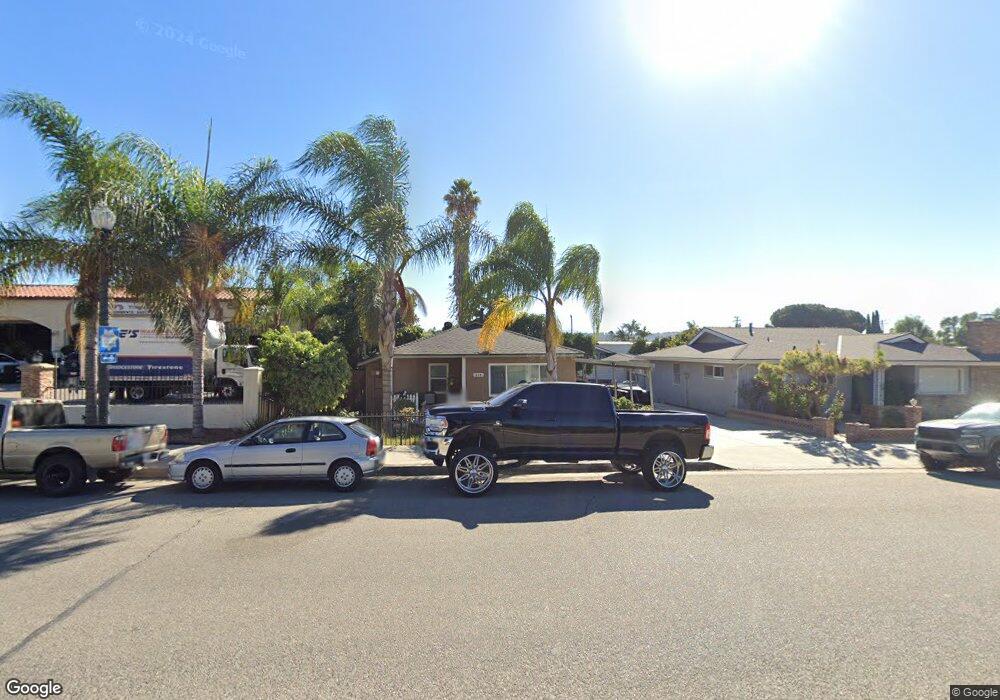
446 E High St Moorpark, CA 93021
Estimated Value: $517,000 - $747,000
3
Beds
1
Bath
1,122
Sq Ft
$572/Sq Ft
Est. Value
About This Home
This home is located at 446 E High St, Moorpark, CA 93021 and is currently estimated at $641,470, approximately $571 per square foot. 446 E High St is a home located in Ventura County with nearby schools including Mountain Meadows Elementary School, Chaparral Middle School, and Moorpark High School.
Ownership History
Date
Name
Owned For
Owner Type
Purchase Details
Closed on
Aug 2, 2016
Sold by
Rose Laila
Bought by
Rose Laila
Current Estimated Value
Purchase Details
Closed on
Apr 19, 2013
Sold by
Sally Gomez Family Trust and Miranda Manuel
Bought by
Rose Laila
Purchase Details
Closed on
Jan 24, 2013
Sold by
Dietrick Margaret and Miranda Margaret
Bought by
Carter Jennie
Purchase Details
Closed on
Jan 17, 2003
Sold by
Miranda Salu Ochoa and Gomez Sally
Bought by
Gomez Sally
Purchase Details
Closed on
Dec 24, 2002
Sold by
Miranda Louis
Bought by
Miranda Salu Ochoa and Gomez Sally
Purchase Details
Closed on
Oct 1, 2002
Sold by
Miranda Joe
Bought by
Miranda Salu Ochoa and Gomez Sally
Purchase Details
Closed on
Sep 30, 2002
Sold by
Miranda Rosie
Bought by
Miranda Salu Ochoa and Gomez Sally
Create a Home Valuation Report for This Property
The Home Valuation Report is an in-depth analysis detailing your home's value as well as a comparison with similar homes in the area
Home Values in the Area
Average Home Value in this Area
Purchase History
| Date | Buyer | Sale Price | Title Company |
|---|---|---|---|
| Rose Laila | -- | None Available | |
| Rose Laila | $205,000 | Chicago Title Company | |
| Carter Jennie | $12,500 | None Available | |
| Gomez Sally | -- | -- | |
| Miranda Salu Ochoa | -- | -- | |
| Miranda Salu Ochoa | -- | -- | |
| Miranda Salu Ochoa | -- | -- | |
| Miranda Salu Ochoa | -- | -- | |
| Miranda Salu Ochoa | -- | -- |
Source: Public Records
Tax History Compared to Growth
Tax History
| Year | Tax Paid | Tax Assessment Tax Assessment Total Assessment is a certain percentage of the fair market value that is determined by local assessors to be the total taxable value of land and additions on the property. | Land | Improvement |
|---|---|---|---|---|
| 2025 | $2,781 | $252,428 | $100,971 | $151,457 |
| 2024 | $2,781 | $247,479 | $98,991 | $148,488 |
| 2023 | $2,720 | $242,627 | $97,050 | $145,577 |
| 2022 | $2,650 | $237,870 | $95,147 | $142,723 |
| 2021 | $2,644 | $233,206 | $93,281 | $139,925 |
| 2020 | $2,619 | $230,818 | $92,326 | $138,492 |
| 2019 | $2,561 | $226,293 | $90,516 | $135,777 |
| 2018 | $2,534 | $221,857 | $88,742 | $133,115 |
| 2017 | $2,482 | $217,507 | $87,002 | $130,505 |
| 2016 | $2,436 | $213,244 | $85,297 | $127,947 |
| 2015 | $2,402 | $210,043 | $84,017 | $126,026 |
| 2014 | $2,339 | $205,930 | $82,372 | $123,558 |
Source: Public Records
Map
Nearby Homes
- 445 Millard St
- 540 Spring Rd Unit 94
- 540 Spring Rd Unit 93
- 31 Fremont Ave
- 13191 Westcott Ct
- 1363 Walnut Canyon Rd
- 150 Majestic Ct Unit 1102
- 4540 Mill Valley Rd
- 4566 N Canyonlands Rd
- 13170 Bent Grass Place
- 14291 Clemson St
- 6852 Shadow Wood Dr
- 4529 N Canyonlands Rd
- 4543 Silverbell Cir
- 6860 Ivy Creek Way Unit 6860
- 6928 Shadow Wood Dr
- 6888 Coppercreek Place
- 13729 Bear Valley Rd
- 13191 Honeybee St
- 13749 Gunsmoke Rd
- 440 E High St
- 0 Bonnie View Unit 218005848
- 0 Bonnie View Unit V1-11420
- 0 Bonnie View Unit V0-217007242
- 0 Bonnie View Unit V0-218005848
- 0 Bonnie View Unit 219006662
- 0 Bonnie View Unit 217007242
- 481 E High St
- 433 Dorothy Ave
- 419 Dorothy Ave
- 447 Dorothy Ave
- 405 Dorothy Ave
- 467 Dorothy Ave
- 391 Dorothy Ave
- 460 Charles St
- 385 E High St
- 470 Charles St
- 375 Dorothy Ave
- 508 Harry St
- 325 E High St