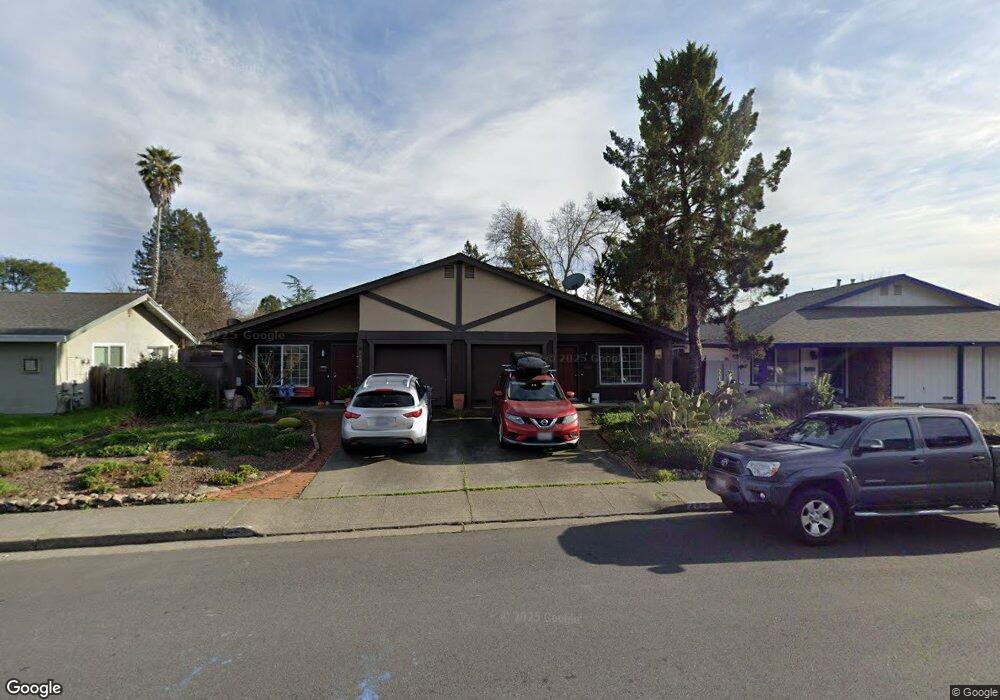
446 Lincoln Ave Cotati, CA 94931
Estimated Value: $739,145 - $804,000
4
Beds
2
Baths
1,716
Sq Ft
$448/Sq Ft
Est. Value
About This Home
This home is located at 446 Lincoln Ave, Cotati, CA 94931 and is currently estimated at $769,536, approximately $448 per square foot. 446 Lincoln Ave is a home located in Sonoma County with nearby schools including Rancho Cotate High School, Cross & Crown Lutheran School, and Bridghaven.
Ownership History
Date
Name
Owned For
Owner Type
Purchase Details
Closed on
Oct 27, 2017
Sold by
Millerick Jeffrey T
Bought by
Millerick Jeffrey T and The Jeffrey T Millerick Revocx
Current Estimated Value
Purchase Details
Closed on
Jan 5, 2010
Sold by
Millerick Jeffery T and Millerick Jeffrey T
Bought by
Millerick Jeffery T
Home Financials for this Owner
Home Financials are based on the most recent Mortgage that was taken out on this home.
Original Mortgage
$145,000
Outstanding Balance
$94,327
Interest Rate
4.77%
Mortgage Type
New Conventional
Estimated Equity
$675,209
Purchase Details
Closed on
Apr 5, 1999
Sold by
Davis Robert Scott and Kemmerer Joel
Bought by
Millerick Jeffery T
Home Financials for this Owner
Home Financials are based on the most recent Mortgage that was taken out on this home.
Original Mortgage
$145,000
Interest Rate
6.91%
Mortgage Type
Stand Alone First
Purchase Details
Closed on
Sep 15, 1993
Sold by
Davis Rose
Bought by
Davis Rose
Create a Home Valuation Report for This Property
The Home Valuation Report is an in-depth analysis detailing your home's value as well as a comparison with similar homes in the area
Home Values in the Area
Average Home Value in this Area
Purchase History
| Date | Buyer | Sale Price | Title Company |
|---|---|---|---|
| Millerick Jeffrey T | -- | None Available | |
| Millerick Jeffery T | -- | Fidelity National Title Co | |
| Millerick Jeffery T | $200,000 | Sonoma Title Guaranty Compan | |
| Davis Rose | -- | -- |
Source: Public Records
Mortgage History
| Date | Status | Borrower | Loan Amount |
|---|---|---|---|
| Open | Millerick Jeffery T | $145,000 | |
| Closed | Millerick Jeffery T | $145,000 |
Source: Public Records
Tax History
| Year | Tax Paid | Tax Assessment Tax Assessment Total Assessment is a certain percentage of the fair market value that is determined by local assessors to be the total taxable value of land and additions on the property. | Land | Improvement |
|---|---|---|---|---|
| 2025 | $3,952 | $313,528 | $133,250 | $180,278 |
| 2024 | $3,952 | $307,382 | $130,638 | $176,744 |
| 2023 | $3,952 | $301,356 | $128,077 | $173,279 |
| 2022 | $3,863 | $295,448 | $125,566 | $169,882 |
| 2021 | $3,826 | $289,655 | $123,104 | $166,551 |
| 2020 | $3,868 | $286,686 | $121,842 | $164,844 |
| 2019 | $3,820 | $281,065 | $119,453 | $161,612 |
| 2018 | $3,534 | $275,555 | $117,111 | $158,444 |
| 2017 | $3,477 | $270,153 | $114,815 | $155,338 |
| 2016 | $3,334 | $264,857 | $112,564 | $152,293 |
| 2015 | $3,256 | $260,880 | $110,874 | $150,006 |
| 2014 | $3,234 | $255,771 | $108,703 | $147,068 |
Source: Public Records
Map
Nearby Homes
- 8383 Lasalle Ave Unit 66
- 293 Lincoln Ave
- 8 Bay Tree Ct
- 850 E Cotati Ave Unit 11
- 105 Falcon Dr
- 8633 Lancaster Dr
- 7799 Blair Ave
- 6698 Santero Way
- 8020 Beverly Dr
- 8312 Windmill Farms Dr
- 8175 Arthur St
- 1216 Mateo Dr
- 1217 Mateo Dr
- 8356 Windmill Farms Dr
- 286 Bruce Ave
- 9 Ramble Creek Dr
- 8873 Lebec Ln
- 95 Jagla St
- 7773 Bonita Ave
- 8092 Sunflower Dr
- 432 Lincoln Ave
- 8375 Lakewood Ave
- 8385 Lakewood Ave
- 437 Larkspur Ct
- 424 Lincoln Ave
- 433 Larkspur Ct
- 435 Lincoln Ave
- 8393 Lakewood Ave
- 437 Lincoln Ave
- 431 Lincoln Ave
- 455 Lincoln Ave
- 457 Lincoln Ave
- 433 Lincoln Ave Unit 58
- 418 Lincoln Ave
- 451 Lincoln Ave Unit 49
- 8372 Lakewood Ave
- 453 Lincoln Ave Unit 50
- 427 Lincoln Ave
- 442 Larkspur Ct
- 425 Lincoln Ave
Your Personal Tour Guide
Ask me questions while you tour the home.