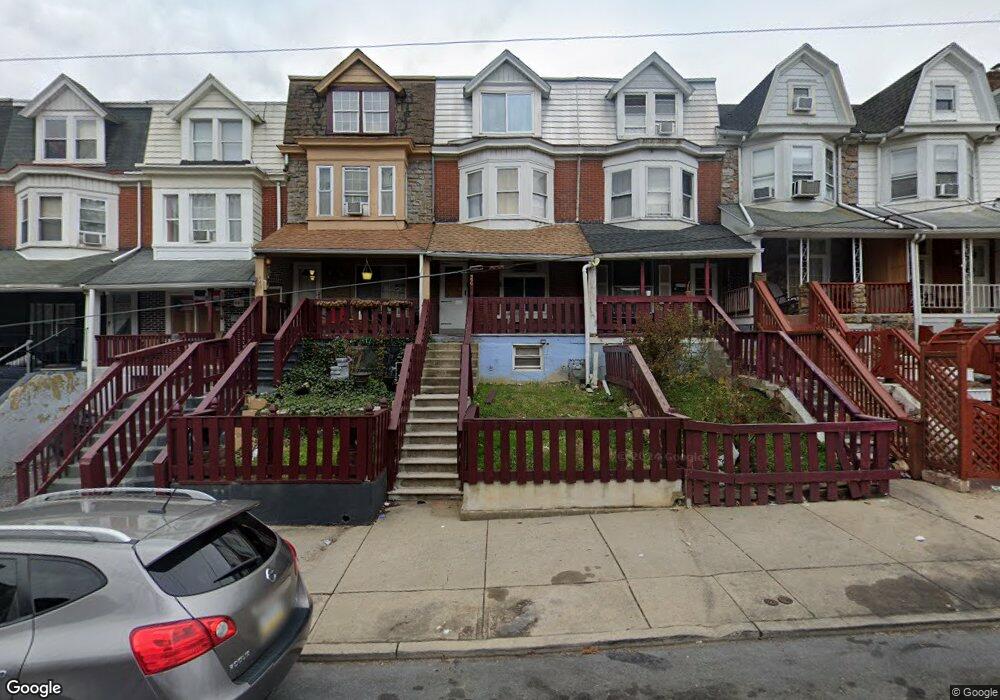
446 N Jordan St Allentown, PA 18102
Center City NeighborhoodEstimated Value: $155,000 - $228,000
5
Beds
1
Bath
1,784
Sq Ft
$115/Sq Ft
Est. Value
About This Home
This home is located at 446 N Jordan St, Allentown, PA 18102 and is currently estimated at $204,478, approximately $114 per square foot. 446 N Jordan St is a home located in Lehigh County with nearby schools including Central Elementary School, Harrison-Morton Middle School, and Louis E. Dieruff High School.
Ownership History
Date
Name
Owned For
Owner Type
Purchase Details
Closed on
Jul 5, 2019
Sold by
Manzueta Nidia Celeste
Bought by
Jmd Property Investment Inc
Current Estimated Value
Purchase Details
Closed on
Apr 15, 2010
Sold by
Hummel Bryan S
Bought by
Manzueta Nidia C
Home Financials for this Owner
Home Financials are based on the most recent Mortgage that was taken out on this home.
Original Mortgage
$56,878
Interest Rate
4.88%
Mortgage Type
FHA
Purchase Details
Closed on
Nov 2, 1988
Sold by
Hummel Bruce P and Hummel Theresa R
Bought by
Hummel Bruce P
Purchase Details
Closed on
Jan 14, 1987
Sold by
Rutt Barry W and Rutt Deborah A
Bought by
Hummel Bruce P and Hummel Theresa R
Purchase Details
Closed on
Apr 26, 1976
Bought by
Rutt Barry W and Rutt Deborah A
Create a Home Valuation Report for This Property
The Home Valuation Report is an in-depth analysis detailing your home's value as well as a comparison with similar homes in the area
Home Values in the Area
Average Home Value in this Area
Purchase History
| Date | Buyer | Sale Price | Title Company |
|---|---|---|---|
| Jmd Property Investment Inc | $78,000 | Quaint Oak Abstract Llc | |
| Manzueta Nidia C | $61,000 | -- | |
| Hummel Bruce P | -- | -- | |
| Hummel Bruce P | $34,900 | -- | |
| Rutt Barry W | $14,900 | -- |
Source: Public Records
Mortgage History
| Date | Status | Borrower | Loan Amount |
|---|---|---|---|
| Previous Owner | Manzueta Nidia C | $56,878 |
Source: Public Records
Tax History Compared to Growth
Tax History
| Year | Tax Paid | Tax Assessment Tax Assessment Total Assessment is a certain percentage of the fair market value that is determined by local assessors to be the total taxable value of land and additions on the property. | Land | Improvement |
|---|---|---|---|---|
| 2025 | $2,196 | $67,800 | $5,400 | $62,400 |
| 2024 | $2,196 | $67,800 | $5,400 | $62,400 |
| 2023 | $2,196 | $67,800 | $5,400 | $62,400 |
| 2022 | $2,119 | $67,800 | $62,400 | $5,400 |
| 2021 | $2,077 | $67,800 | $5,400 | $62,400 |
| 2020 | $2,022 | $67,800 | $5,400 | $62,400 |
| 2019 | $1,989 | $67,800 | $5,400 | $62,400 |
| 2018 | $1,858 | $67,800 | $5,400 | $62,400 |
| 2017 | $1,811 | $67,800 | $5,400 | $62,400 |
| 2016 | -- | $67,800 | $5,400 | $62,400 |
| 2015 | -- | $67,800 | $5,400 | $62,400 |
| 2014 | -- | $67,800 | $5,400 | $62,400 |
Source: Public Records
Map
Nearby Homes
- 418 N Jordan St
- 522 N Jordan St
- 440 N 4th St
- 384 W Gordon St
- 419 W Liberty St
- 424 W Liberty St
- 454 W Liberty St
- 308 W Liberty St
- 448 W Gordon St
- 407 N 5th St
- 392 W Tilghman St
- 416 N 5th St
- 643 N 4th St
- 514 N 5th St
- 215 W Liberty St
- 701 N Jordan St
- 516 N 2nd St
- 408 N 2nd St
- 431 Tilghman St
- 526 W Gordon St Unit 1
- 448 N Jordan St
- 448 N Jordan St Unit Lot 15
- 450 N Jordan St
- 450 N Jordan St Unit Lot 16
- 444 N Jordan St
- 452 N Jordan St
- 452 N Jordan St Unit Lot 17
- 454 N Jordan St
- 454 N Jordan St Unit Lot 18
- 442 N Jordan St
- 456 N Jordan St
- 456 N Jordan St Unit Lot 19
- 440 N Jordan St
- 460 N Jordan St
- 458 N Jordan St Unit Lot 20
- 458 N Jordan St
- 438 N Jordan St
- 434 N Jordan St
- 432 N Jordan St
- 430 N Jordan St