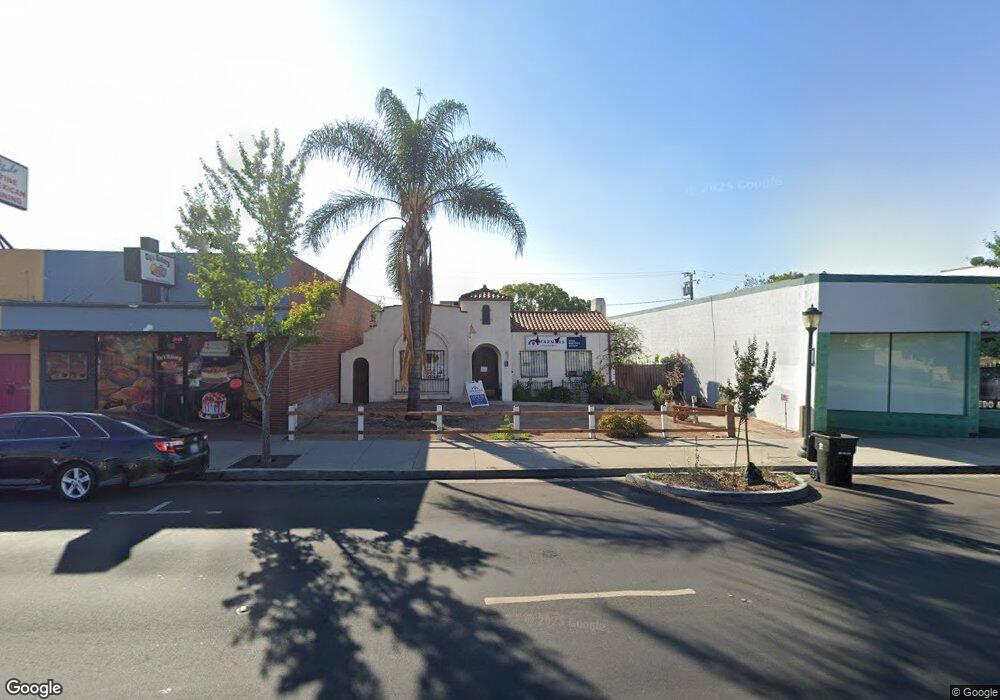
446 N Maclay Ave San Fernando, CA 91340
Estimated Value: $701,000 - $817,000
2
Beds
2
Baths
1,344
Sq Ft
$547/Sq Ft
Est. Value
About This Home
This home is located at 446 N Maclay Ave, San Fernando, CA 91340 and is currently estimated at $735,635, approximately $547 per square foot. 446 N Maclay Ave is a home located in Los Angeles County with nearby schools including Morningside Elementary School, San Fernando Middle School, and San Fernando Senior High School.
Ownership History
Date
Name
Owned For
Owner Type
Purchase Details
Closed on
Jun 23, 2008
Sold by
Martinez & Mota Holdings Llc
Bought by
Martinez Silvia
Current Estimated Value
Purchase Details
Closed on
Sep 26, 2007
Sold by
Martinez Silvia
Bought by
Martinez & Mota Holdings Llc
Purchase Details
Closed on
Mar 23, 2004
Sold by
Doval Robert and Doval Elin L
Bought by
Martinez Silvia
Purchase Details
Closed on
Jun 30, 1995
Sold by
Specockorp Inc
Bought by
Sawyer Laverne H
Home Financials for this Owner
Home Financials are based on the most recent Mortgage that was taken out on this home.
Original Mortgage
$14,550
Interest Rate
7.8%
Mortgage Type
Seller Take Back
Purchase Details
Closed on
Jun 15, 1994
Sold by
First Independent Trust Deed Services
Bought by
Specockorp
Create a Home Valuation Report for This Property
The Home Valuation Report is an in-depth analysis detailing your home's value as well as a comparison with similar homes in the area
Home Values in the Area
Average Home Value in this Area
Purchase History
| Date | Buyer | Sale Price | Title Company |
|---|---|---|---|
| Martinez Silvia | -- | None Available | |
| Martinez Silvia | -- | None Available | |
| Martinez Silvia | -- | None Available | |
| Martinez & Mota Holdings Llc | -- | None Available | |
| Martinez Silvia | $360,000 | First American Title Co Los | |
| Sawyer Laverne H | -- | First American | |
| Specockorp | $110,239 | -- |
Source: Public Records
Mortgage History
| Date | Status | Borrower | Loan Amount |
|---|---|---|---|
| Previous Owner | Sawyer Laverne H | $14,550 |
Source: Public Records
Tax History Compared to Growth
Tax History
| Year | Tax Paid | Tax Assessment Tax Assessment Total Assessment is a certain percentage of the fair market value that is determined by local assessors to be the total taxable value of land and additions on the property. | Land | Improvement |
|---|---|---|---|---|
| 2025 | $5,689 | $398,845 | $153,233 | $245,612 |
| 2024 | $5,689 | $391,026 | $150,229 | $240,797 |
| 2023 | $5,656 | $383,360 | $147,284 | $236,076 |
| 2022 | $5,413 | $375,845 | $144,397 | $231,448 |
| 2021 | $5,270 | $368,476 | $141,566 | $226,910 |
| 2019 | $5,256 | $357,549 | $137,368 | $220,181 |
| 2018 | $5,146 | $350,539 | $134,675 | $215,864 |
| 2016 | $4,949 | $336,930 | $129,447 | $207,483 |
| 2015 | $4,745 | $319,295 | $127,503 | $191,792 |
| 2014 | $4,737 | $313,042 | $125,006 | $188,036 |
Source: Public Records
Map
Nearby Homes
- 1409 4th St
- 129 N Hagar St
- 556 Harps St
- 431 N Workman St
- 1000 Glenoaks Blvd
- 818 N Brand Blvd
- 815 N Hagar St
- 766 Harding Ave
- 827 Griswold Ave
- 11644 Woodcock Ave
- 901 N Maclay Ave
- 418 San Fernando Mission Blvd
- 921 N Brand Blvd
- 13966 Fox St
- 1319 Hollister St
- 1037 Kewen St
- 613 N Meyer St
- 1933 Glenoaks Blvd Unit 127
- 1921 Glenoaks Blvd Unit 196
- 1926 Lucas St Unit 2
- 450 N Maclay Ave
- 432 N Maclay Ave
- 447 N Macneil St
- 443 N Macneil St
- 439 N Macneil St
- 418 N Maclay Ave
- 433 N Macneil St
- 428 N Maclay Ave
- 411 N Maclay Ave
- 447 N Maclay Ave
- 443 N Maclay Ave
- 504 N Maclay Ave Unit 4
- 504 N Maclay Ave Unit 1
- 504 N Maclay Ave
- 431 N Macneil St
- 1015 Library St
- 429 N Macneil St
- 1009 Library St
- 427 N Macneil St
- 433 N Maclay Ave