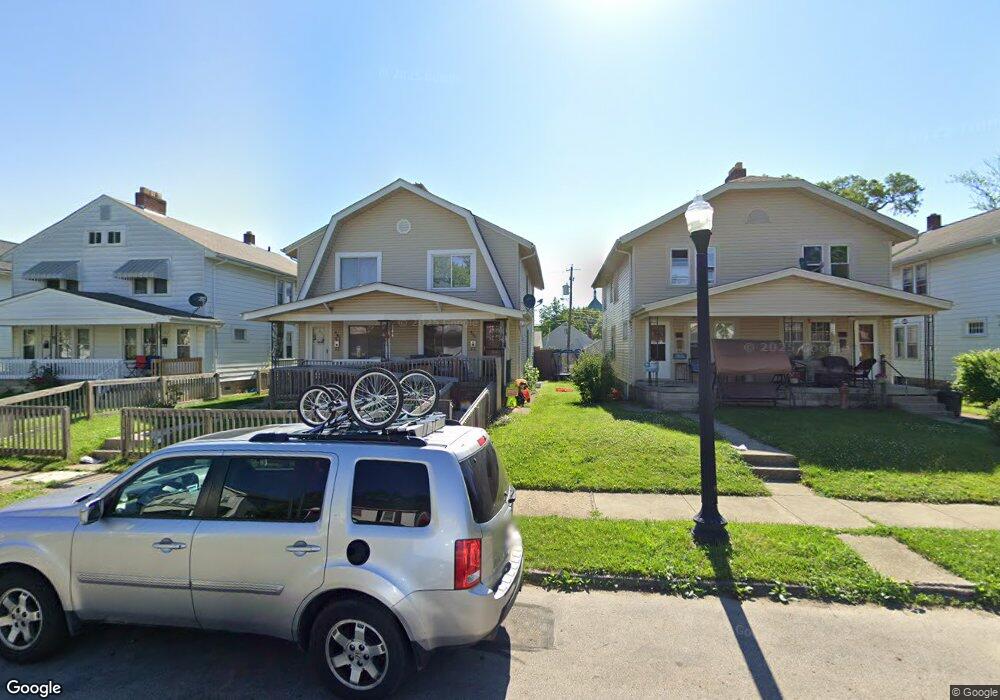
446 S Huron Ave Unit 448 Columbus, OH 43204
Westgate NeighborhoodEstimated Value: $207,000 - $301,000
6
Beds
2
Baths
2,352
Sq Ft
$112/Sq Ft
Est. Value
About This Home
This home is located at 446 S Huron Ave Unit 448, Columbus, OH 43204 and is currently estimated at $264,426, approximately $112 per square foot. 446 S Huron Ave Unit 448 is a home located in Franklin County with nearby schools including Westgate Alternative Elementary School, Westmoor Middle School, and West High School.
Ownership History
Date
Name
Owned For
Owner Type
Purchase Details
Closed on
Dec 11, 2018
Sold by
Lee David C
Bought by
Plenty Of Room Llc
Current Estimated Value
Purchase Details
Closed on
Oct 2, 2017
Sold by
Hadley Michelle
Bought by
Lee David C
Purchase Details
Closed on
Jan 20, 2016
Sold by
Wiener Anita Callen
Bought by
Hadley Michelle
Purchase Details
Closed on
Nov 12, 2010
Sold by
Yin Hak Mey
Bought by
Wiener Anita Callen
Purchase Details
Closed on
Sep 26, 2007
Sold by
Estate Of Sao Srey
Bought by
Yin Hak Mey
Purchase Details
Closed on
Dec 13, 1996
Sold by
Vanmen
Bought by
Srey Sao and Yin Hak M
Purchase Details
Closed on
Jun 3, 1994
Sold by
Dee Diane M
Bought by
Yin Sao Srey Hak Mey
Home Financials for this Owner
Home Financials are based on the most recent Mortgage that was taken out on this home.
Original Mortgage
$75,961
Interest Rate
8.48%
Mortgage Type
FHA
Purchase Details
Closed on
Jul 27, 1992
Create a Home Valuation Report for This Property
The Home Valuation Report is an in-depth analysis detailing your home's value as well as a comparison with similar homes in the area
Home Values in the Area
Average Home Value in this Area
Purchase History
| Date | Buyer | Sale Price | Title Company |
|---|---|---|---|
| Plenty Of Room Llc | -- | Preferred Title & Guaranty | |
| Lee David C | $70,000 | None Available | |
| Hadley Michelle | $83,700 | Attorney | |
| Wiener Anita Callen | $99,000 | Land & Mo | |
| Yin Hak Mey | -- | None Available | |
| Srey Sao | $39,900 | -- | |
| Yin Sao Srey Hak Mey | $79,900 | -- | |
| -- | $58,000 | -- |
Source: Public Records
Mortgage History
| Date | Status | Borrower | Loan Amount |
|---|---|---|---|
| Previous Owner | Yin Sao Srey Hak Mey | $75,961 |
Source: Public Records
Tax History
| Year | Tax Paid | Tax Assessment Tax Assessment Total Assessment is a certain percentage of the fair market value that is determined by local assessors to be the total taxable value of land and additions on the property. | Land | Improvement |
|---|---|---|---|---|
| 2025 | $4,045 | $88,270 | $22,470 | $65,800 |
| 2024 | $4,045 | $88,270 | $22,470 | $65,800 |
| 2023 | $3,995 | $88,270 | $22,470 | $65,800 |
| 2022 | $1,853 | $34,870 | $7,600 | $27,270 |
| 2021 | $2,135 | $34,870 | $7,600 | $27,270 |
| 2020 | $1,859 | $34,870 | $7,600 | $27,270 |
| 2019 | $1,807 | $29,060 | $6,340 | $22,720 |
| 2018 | $1,887 | $29,060 | $6,340 | $22,720 |
| 2017 | $2,609 | $42,500 | $6,340 | $36,160 |
| 2016 | $1,966 | $29,300 | $7,630 | $21,670 |
| 2015 | $1,787 | $29,300 | $7,630 | $21,670 |
| 2014 | $1,791 | $29,300 | $7,630 | $21,670 |
| 2013 | $983 | $32,585 | $8,505 | $24,080 |
Source: Public Records
Map
Nearby Homes
- 415 S Huron Ave Unit 417
- 3001 Wicklow Rd
- 457 Guernsey Ave
- 363 S Chase Ave
- 327 S Chase Ave
- 575 Chestershire Rd
- 638 Binns Blvd
- 0 S Brinker Ave
- 642 S Roys Ave
- 2845 Fremont St
- 2835 Sullivant Ave
- 261 S Chase Ave
- 207 S Huron Ave
- 423 S Hague Ave
- 181 S Westgate Ave
- 638 Wiltshire Rd
- 253 Powhatan Ave
- 361 S Harris Ave Unit 361
- 140 Guernsey Ave
- 623 S Harris Ave
- 446-448 S Huron Ave
- 448 S Huron Ave
- 452 S Huron Ave Unit 454
- 440 S Huron Ave Unit 442
- 440 S Huron Ave Unit 2
- 458 S Huron Ave Unit 460
- 458-460 S Huron Ave Unit 458 and 460
- 434-436 S Huron Ave
- 434 S Huron Ave Unit 436
- 434 S Huron Ave Unit 36
- 462 S Huron Ave Unit 464
- 449 Binns Blvd
- 455 Binns Blvd
- 439 Binns Blvd
- 468 S Huron Ave Unit 470
- 459 Binns Blvd
- 443 S Huron Ave
- 449 S Huron Ave
- 3027 Wicklow Rd
- 433 Binns Blvd
Your Personal Tour Guide
Ask me questions while you tour the home.