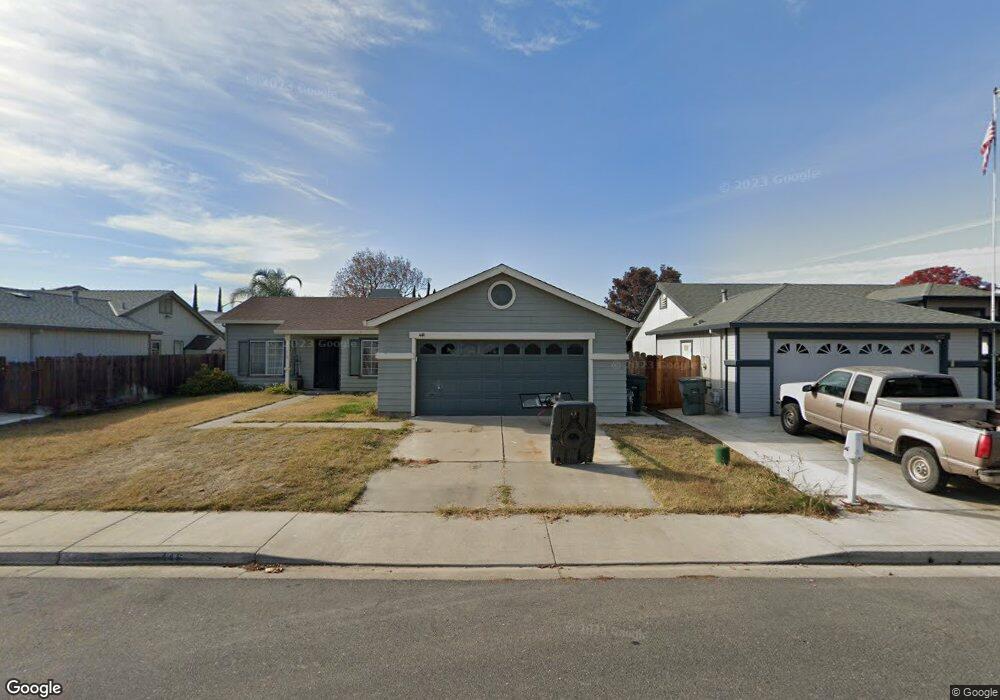
446 Sumac Ln Newman, CA 95360
Estimated Value: $316,000 - $419,000
3
Beds
2
Baths
1,230
Sq Ft
$307/Sq Ft
Est. Value
About This Home
This home is located at 446 Sumac Ln, Newman, CA 95360 and is currently estimated at $377,146, approximately $306 per square foot. 446 Sumac Ln is a home located in Stanislaus County with nearby schools including Orestimba High School.
Ownership History
Date
Name
Owned For
Owner Type
Purchase Details
Closed on
Jul 25, 2011
Sold by
Delash Elaine M and Robinson Daniel A
Bought by
Delash Elaine and Robinson Daniel A
Current Estimated Value
Purchase Details
Closed on
May 24, 2010
Sold by
Robinson Minnie
Bought by
Robinson Minnie F and The Richard & Minnie Robinson
Purchase Details
Closed on
Mar 16, 2010
Sold by
Bank Of America National Association
Bought by
Robinson Minnie
Purchase Details
Closed on
Feb 12, 2010
Sold by
Pansoy Linda L and Pansoy Cisan
Bought by
Bank Of America National Association
Purchase Details
Closed on
Dec 12, 2006
Sold by
Pansoy Cisan and Pansoy Linda L
Bought by
Pansoy Cisan and Pansoy Linda L
Home Financials for this Owner
Home Financials are based on the most recent Mortgage that was taken out on this home.
Original Mortgage
$260,000
Interest Rate
7.78%
Mortgage Type
Negative Amortization
Create a Home Valuation Report for This Property
The Home Valuation Report is an in-depth analysis detailing your home's value as well as a comparison with similar homes in the area
Home Values in the Area
Average Home Value in this Area
Purchase History
| Date | Buyer | Sale Price | Title Company |
|---|---|---|---|
| Delash Elaine | -- | None Available | |
| Robinson Minnie F | -- | None Available | |
| Robinson Minnie | $82,500 | Chicago Title Company | |
| Bank Of America National Association | $72,250 | Service Link | |
| Pansoy Cisan | -- | Alliance Title Company |
Source: Public Records
Mortgage History
| Date | Status | Borrower | Loan Amount |
|---|---|---|---|
| Previous Owner | Pansoy Cisan | $260,000 |
Source: Public Records
Tax History
| Year | Tax Paid | Tax Assessment Tax Assessment Total Assessment is a certain percentage of the fair market value that is determined by local assessors to be the total taxable value of land and additions on the property. | Land | Improvement |
|---|---|---|---|---|
| 2025 | $1,415 | $106,477 | $45,171 | $61,306 |
| 2024 | $1,380 | $104,390 | $44,286 | $60,104 |
| 2023 | $1,343 | $102,344 | $43,418 | $58,926 |
| 2022 | $1,318 | $100,338 | $42,567 | $57,771 |
| 2021 | $1,294 | $98,372 | $41,733 | $56,639 |
| 2020 | $1,269 | $97,365 | $41,306 | $56,059 |
| 2019 | $1,272 | $95,457 | $40,497 | $54,960 |
| 2018 | $1,193 | $93,586 | $39,703 | $53,883 |
| 2017 | $1,283 | $91,752 | $38,925 | $52,827 |
| 2016 | $1,147 | $89,954 | $38,162 | $51,792 |
| 2015 | $1,177 | $88,604 | $37,589 | $51,015 |
| 2014 | $1,166 | $86,869 | $36,853 | $50,016 |
Source: Public Records
Map
Nearby Homes
- 1232 Woodduck Ct
- 507 Lady Slipper Ln
- 613 Ranee Ct
- 1336 Red Teal Dr
- 1363 Merganser Ct
- 941 Haycastle Ct
- 501 Flour Mill Dr
- 429 Red Lion Way
- 344 Red Lion Way
- 1235 N St
- 537 Bonanza Dr
- 407 Northampton Way
- 918 Castellona Dr
- 1939 L St
- 662 Cedar Mountain Dr
- 154 Splendido Ct
- 619-657 Inyo Ave
- 737 Orestimba Peak Dr
- 1118 Strawbridge Dr
- 728 R St
Your Personal Tour Guide
Ask me questions while you tour the home.