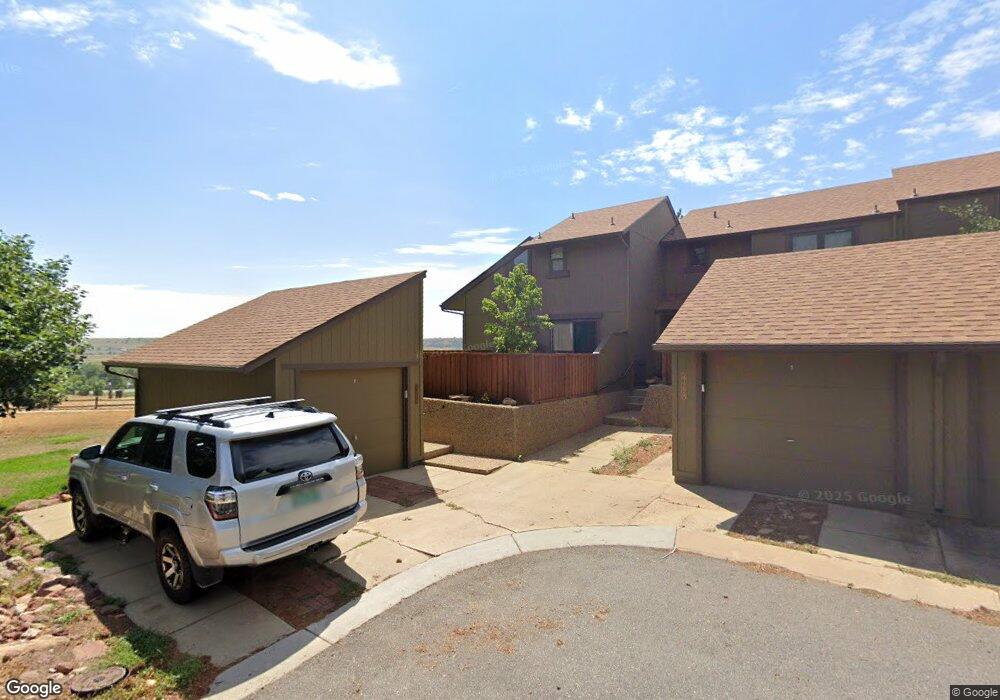
4460 Greenbriar Blvd Boulder, CO 80305
Table Mesa NeighborhoodEstimated Value: $759,000 - $815,000
3
Beds
3
Baths
1,710
Sq Ft
$461/Sq Ft
Est. Value
About This Home
This home is located at 4460 Greenbriar Blvd, Boulder, CO 80305 and is currently estimated at $787,802, approximately $460 per square foot. 4460 Greenbriar Blvd is a home located in Boulder County with nearby schools including Mesa Elementary School, Bear Creek Elementary School, and Southern Hills Middle School.
Ownership History
Date
Name
Owned For
Owner Type
Purchase Details
Closed on
Sep 14, 2010
Sold by
Fannie Mae
Bought by
Hogan Mary L
Current Estimated Value
Purchase Details
Closed on
Apr 1, 2010
Sold by
Lee John M
Bought by
Federal National Mortgage Association
Purchase Details
Closed on
Jan 3, 2002
Sold by
Willix Mary K
Bought by
Lee John M
Home Financials for this Owner
Home Financials are based on the most recent Mortgage that was taken out on this home.
Original Mortgage
$62,000
Interest Rate
7.25%
Purchase Details
Closed on
Jul 29, 1994
Sold by
Burrell Robert
Bought by
Willix Mary K
Home Financials for this Owner
Home Financials are based on the most recent Mortgage that was taken out on this home.
Original Mortgage
$115,500
Interest Rate
8.3%
Purchase Details
Closed on
Jun 2, 1992
Bought by
Hogan Mary L
Purchase Details
Closed on
May 14, 1990
Bought by
Hogan Mary L
Purchase Details
Closed on
Dec 1, 1982
Bought by
Hogan Mary L
Create a Home Valuation Report for This Property
The Home Valuation Report is an in-depth analysis detailing your home's value as well as a comparison with similar homes in the area
Home Values in the Area
Average Home Value in this Area
Purchase History
| Date | Buyer | Sale Price | Title Company |
|---|---|---|---|
| Hogan Mary L | $329,900 | None Available | |
| Federal National Mortgage Association | -- | None Available | |
| Lee John M | $292,000 | -- | |
| Willix Mary K | $165,000 | First American Heritage Titl | |
| Hogan Mary L | $85,000 | -- | |
| Hogan Mary L | -- | -- | |
| Hogan Mary L | $78,500 | -- |
Source: Public Records
Mortgage History
| Date | Status | Borrower | Loan Amount |
|---|---|---|---|
| Previous Owner | Lee John M | $62,000 | |
| Previous Owner | Willix Mary K | $115,500 |
Source: Public Records
Tax History Compared to Growth
Tax History
| Year | Tax Paid | Tax Assessment Tax Assessment Total Assessment is a certain percentage of the fair market value that is determined by local assessors to be the total taxable value of land and additions on the property. | Land | Improvement |
|---|---|---|---|---|
| 2025 | $4,232 | $53,001 | $29,738 | $23,263 |
| 2024 | $4,232 | $53,001 | $29,738 | $23,263 |
| 2023 | $4,158 | $48,153 | $33,848 | $17,990 |
| 2022 | $3,967 | $42,722 | $26,271 | $16,451 |
| 2021 | $3,783 | $43,951 | $27,027 | $16,924 |
| 2020 | $4,258 | $48,921 | $26,670 | $22,251 |
| 2019 | $4,193 | $48,921 | $26,670 | $22,251 |
| 2018 | $3,677 | $42,408 | $24,048 | $18,360 |
| 2017 | $3,562 | $46,884 | $26,586 | $20,298 |
| 2016 | $3,072 | $35,493 | $19,422 | $16,071 |
| 2015 | $2,909 | $29,619 | $10,666 | $18,953 |
| 2014 | $2,490 | $29,619 | $10,666 | $18,953 |
Source: Public Records
Map
Nearby Homes
- 1624 Bradley Ct
- 1620 Bradley Ct
- 1533 Bradley Dr
- 4204 Greenbriar Blvd Unit 45
- 1596 Bradley Dr Unit 105C
- 4630 MacKy Way
- 3970 Longwood Ave
- 1720 S Marshall Rd Unit 41
- 1720 S Marshall Rd Unit 26
- 1720 S Marshall Rd Unit 24
- 4475 Hastings Dr
- 1080 Tantra Park Cir
- 4814 W Moorhead Cir
- 1215 Berea Dr
- 3410 Heidelberg Dr
- 1019 Tantra Park Cir
- 4250 Whitney Place
- 4733 W Moorhead Cir
- 1395 Drexel St
- 960 Toedtli Dr
- 4460 Greenbriar Blvd Unit 62
- 4456 Greenbriar Blvd
- 4464 Greenbriar Blvd
- 4452 Greenbriar Blvd
- 4448 Greenbriar Blvd
- 4448 Greenbriar Blvd Unit 59
- 4444 Greenbriar Blvd
- 4470 Greenbriar Blvd
- 4470 Greenbriar Blvd Unit 64
- 4472 Greenbriar Blvd
- 4472 Greenbriar Blvd Unit 65
- 4486 Greenbriar Blvd
- 4440 Greenbriar Blvd
- 4484 Greenbriar Blvd
- 4484 Greenbriar Blvd Unit 69
- 4436 Greenbriar Blvd
- 4620 Greenbriar Ct
- 4620 Greenbriar Ct Unit 80
- 4482 Greenbriar Blvd Unit 68
- 4474 Greenbriar Blvd