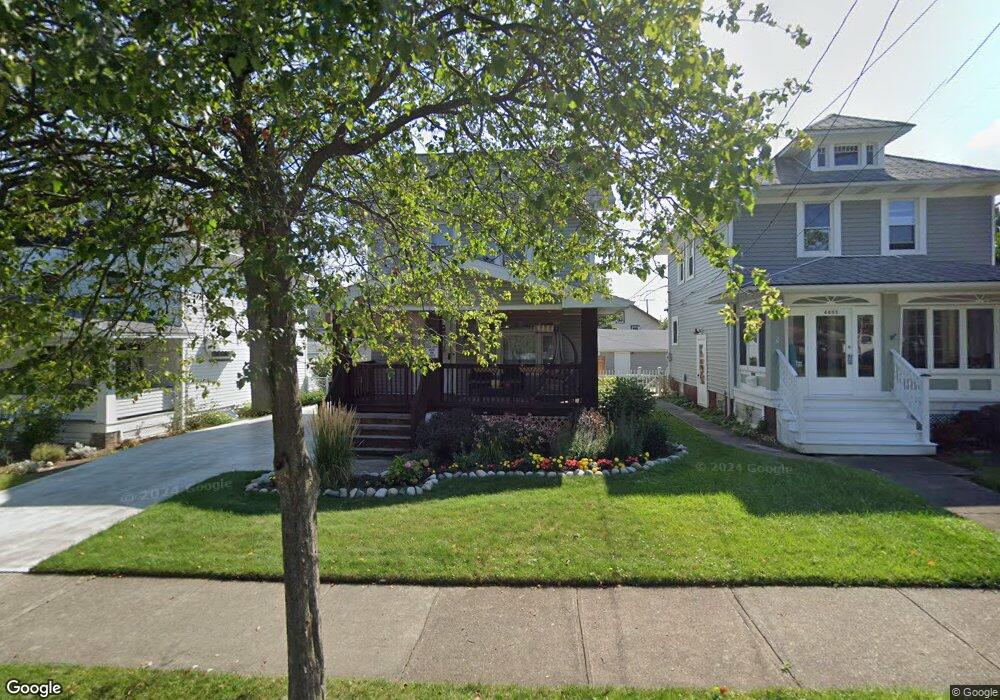
4461 W 48th St Cleveland, OH 44144
Old Brooklyn NeighborhoodEstimated Value: $146,072 - $174,000
3
Beds
1
Bath
998
Sq Ft
$159/Sq Ft
Est. Value
About This Home
This home is located at 4461 W 48th St, Cleveland, OH 44144 and is currently estimated at $158,518, approximately $158 per square foot. 4461 W 48th St is a home located in Cuyahoga County with nearby schools including Benjamin Franklin, Almira Academy, and Artemus Ward School.
Ownership History
Date
Name
Owned For
Owner Type
Purchase Details
Closed on
Oct 31, 1997
Sold by
Gelston Philip B
Bought by
Landrau Elliot D and Landrau Cheryl M
Current Estimated Value
Home Financials for this Owner
Home Financials are based on the most recent Mortgage that was taken out on this home.
Original Mortgage
$90,780
Outstanding Balance
$15,202
Interest Rate
7.51%
Mortgage Type
VA
Estimated Equity
$143,316
Purchase Details
Closed on
Aug 29, 1986
Sold by
Thiel Roy M and Thiel Jeanne M
Bought by
Gelston Philip B and Gelston Nancy J
Purchase Details
Closed on
Nov 1, 1985
Sold by
Theil Roy M
Bought by
Thiel Roy M and Thiel Jeanne M
Purchase Details
Closed on
Apr 19, 1985
Sold by
Cook Douglas A
Bought by
Theil Roy M
Purchase Details
Closed on
Jan 18, 1979
Sold by
Marron Wanda
Bought by
Cook Douglas A
Purchase Details
Closed on
Jun 26, 1978
Sold by
Marron Jas E and Marron Wanda
Bought by
Marron Wanda
Purchase Details
Closed on
Jan 1, 1975
Bought by
Marron Jas E and Marron Wanda
Create a Home Valuation Report for This Property
The Home Valuation Report is an in-depth analysis detailing your home's value as well as a comparison with similar homes in the area
Home Values in the Area
Average Home Value in this Area
Purchase History
| Date | Buyer | Sale Price | Title Company |
|---|---|---|---|
| Landrau Elliot D | $89,000 | -- | |
| Gelston Philip B | $42,000 | -- | |
| Thiel Roy M | -- | -- | |
| Theil Roy M | $42,900 | -- | |
| Cook Douglas A | $34,000 | -- | |
| Marron Wanda | -- | -- | |
| Marron Jas E | -- | -- |
Source: Public Records
Mortgage History
| Date | Status | Borrower | Loan Amount |
|---|---|---|---|
| Open | Landrau Elliot D | $90,780 |
Source: Public Records
Tax History Compared to Growth
Tax History
| Year | Tax Paid | Tax Assessment Tax Assessment Total Assessment is a certain percentage of the fair market value that is determined by local assessors to be the total taxable value of land and additions on the property. | Land | Improvement |
|---|---|---|---|---|
| 2024 | $2,985 | $45,535 | $8,470 | $37,065 |
| 2023 | $1,968 | $25,940 | $5,740 | $20,200 |
| 2022 | $1,956 | $25,940 | $5,740 | $20,200 |
| 2021 | $1,937 | $25,940 | $5,740 | $20,200 |
| 2020 | $1,736 | $20,090 | $4,450 | $15,650 |
| 2019 | $1,605 | $57,400 | $12,700 | $44,700 |
| 2018 | $1,584 | $20,090 | $4,450 | $15,650 |
| 2017 | $1,582 | $19,180 | $3,780 | $15,400 |
| 2016 | $1,569 | $19,180 | $3,780 | $15,400 |
| 2015 | $1,751 | $19,180 | $3,780 | $15,400 |
| 2014 | $1,751 | $21,320 | $4,200 | $17,120 |
Source: Public Records
Map
Nearby Homes
- 4456 W 49th St
- 4427 W 49th St
- 4520 Wichita Ave
- 5000 Behrwald Ave
- 4464 W 53rd St
- 4444 W 53rd St
- 4510 Woburn Ave
- 4503 Fulton Rd
- 5105 Behrwald Ave
- 4373 W 52nd St
- 4456 Fulton Rd
- 4023 Bucyrus Ave
- 4581 Pearl Rd
- 4002 Ardmore Ave
- 4102 Spokane Ave
- 3905 Brooklyn Ave
- 3909 Behrwald Ave
- 3816 Bucyrus Ave
- 4402 W 60th St
- 4216 Clybourne Ave
- 4465 W 48th St
- 4457 W 48th St
- 4455 W 48th St Unit DN
- 4453 W 48th St
- 4453 W 48th St Unit 1/DN
- 4453 W 48th St Unit 2/UP
- 4460 W 47th St
- 4456 W 47th St
- 4464 W 47th St
- 4449 W 48th St
- 4452 W 47th St
- 4445 W 48th St
- 4448 W 47th St
- 4462 W 48th St
- 4715 Ardmore Ave
- 4466 W 48th St
- 4723 Ardmore Ave
- 4709 Ardmore Ave
- 4444 W 47th St
- 4454 W 48th St