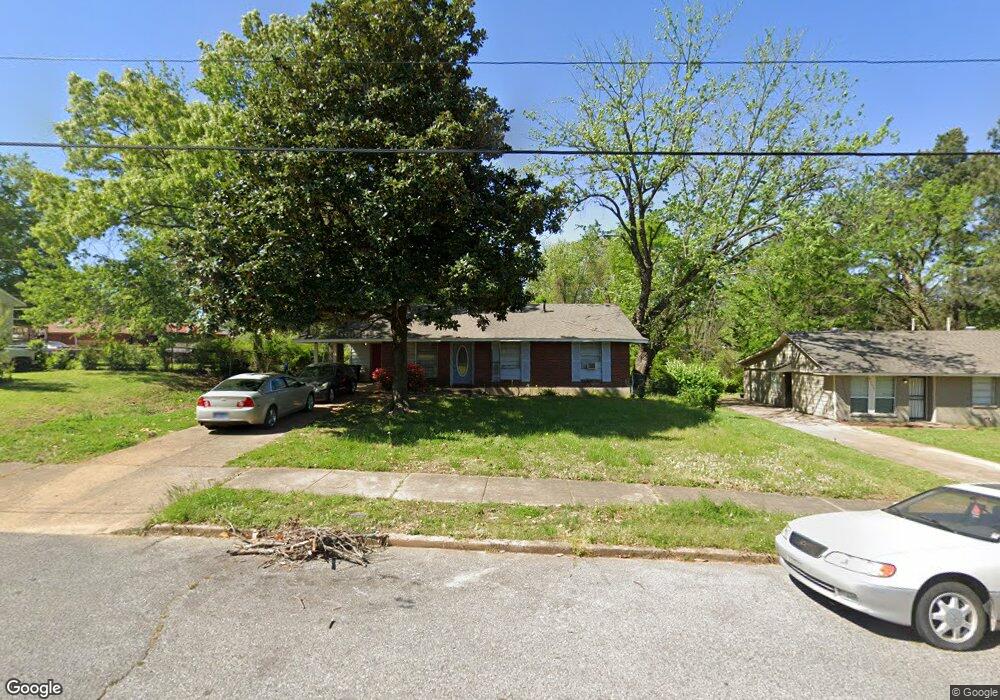
4461 Westmont Rd Memphis, TN 38109
Westwood NeighborhoodEstimated Value: $111,000 - $142,000
4
Beds
2
Baths
1,739
Sq Ft
$75/Sq Ft
Est. Value
About This Home
This home is located at 4461 Westmont Rd, Memphis, TN 38109 and is currently estimated at $130,215, approximately $74 per square foot. 4461 Westmont Rd is a home located in Shelby County with nearby schools including Levi Elementary School, Chickasaw Middle School, and Westwood High School.
Ownership History
Date
Name
Owned For
Owner Type
Purchase Details
Closed on
May 9, 2016
Sold by
Denton Katherine
Bought by
Mdm Investments Of Memphis Llc
Current Estimated Value
Purchase Details
Closed on
Aug 17, 2006
Sold by
Jonco Acquisitions Llc
Bought by
Shelton Ambrose
Home Financials for this Owner
Home Financials are based on the most recent Mortgage that was taken out on this home.
Original Mortgage
$68,000
Interest Rate
9.6%
Mortgage Type
Stand Alone First
Purchase Details
Closed on
Jun 16, 2006
Sold by
Jpmorgan Chase Bank
Bought by
Jonco Acquisitions
Home Financials for this Owner
Home Financials are based on the most recent Mortgage that was taken out on this home.
Original Mortgage
$60,227
Interest Rate
6.57%
Mortgage Type
Purchase Money Mortgage
Purchase Details
Closed on
Feb 9, 2006
Sold by
Mosby Marcus
Bought by
Jpmorgan Chase Bank
Purchase Details
Closed on
Jul 30, 1998
Sold by
Roebuck Lottie D and Roebuck Delois Roebuck
Bought by
Hud
Create a Home Valuation Report for This Property
The Home Valuation Report is an in-depth analysis detailing your home's value as well as a comparison with similar homes in the area
Home Values in the Area
Average Home Value in this Area
Purchase History
| Date | Buyer | Sale Price | Title Company |
|---|---|---|---|
| Mdm Investments Of Memphis Llc | -- | Baymark Title And Escrow Ser | |
| Shelton Ambrose | $85,000 | Real Estate Loan Svcs Tn Inc | |
| Jonco Acquisitions | $54,500 | Resource Title Agency Of Tn | |
| Jpmorgan Chase Bank | $48,800 | None Available | |
| Hud | $44,223 | -- |
Source: Public Records
Mortgage History
| Date | Status | Borrower | Loan Amount |
|---|---|---|---|
| Previous Owner | Shelton Ambrose | $68,000 | |
| Previous Owner | Jonco Acquisitions | $60,227 |
Source: Public Records
Tax History Compared to Growth
Tax History
| Year | Tax Paid | Tax Assessment Tax Assessment Total Assessment is a certain percentage of the fair market value that is determined by local assessors to be the total taxable value of land and additions on the property. | Land | Improvement |
|---|---|---|---|---|
| 2025 | $748 | $31,650 | $2,100 | $29,550 |
| 2024 | $748 | $22,075 | $1,850 | $20,225 |
| 2023 | $1,345 | $22,075 | $1,850 | $20,225 |
| 2022 | $1,345 | $22,075 | $1,850 | $20,225 |
| 2021 | $1,361 | $22,075 | $1,850 | $20,225 |
| 2020 | $1,234 | $17,025 | $1,850 | $15,175 |
| 2019 | $1,234 | $17,025 | $1,850 | $15,175 |
| 2018 | $1,234 | $17,025 | $1,850 | $15,175 |
| 2017 | $700 | $17,025 | $1,850 | $15,175 |
| 2016 | $715 | $16,350 | $0 | $0 |
| 2014 | $715 | $16,350 | $0 | $0 |
Source: Public Records
Map
Nearby Homes
- 806 Parkrose Rd
- 4340 Bluebell St
- 4539 Weaver Rd SW
- 436 Western Park Dr
- 4487 Weaver Rd S
- 693 Bonwood Ave
- 4344 Bow St
- 803 Ledbetter Ave
- 668 Westview Rd
- 4269 Tomahawk St
- 4087 Weaver Rd
- 4233 Glenbrook Dr
- 4501 S 3rd St
- 646 Western Park Dr
- 4334 Melwood St
- 1010 Leacrest Ave
- 1307 W Raines Rd
- 4374 Ford Rd
- 4509 Double Tree Rd
- 830 W Raines Rd
- 4455 Westmont Rd
- 4471 Westmont Rd
- 850 Bramblewood Ln
- 874 W Marigold Ln
- 858 Bramblewood Ln
- 884 W Marigold Ln
- 4487 Westmont Rd
- 849 Bramblewood Ln
- 857 Bramblewood Ln
- 877 W Marigold Ln
- 870 Bramblewood Ln
- 887 W Marigold Ln
- 896 W Marigold Ln
- 4514 Marigold Ln
- 869 Bramblewood Ln
- 880 Bramblewood Ln
- 895 W Marigold Ln
- 4497 Westmont Rd
- 902 W Marigold Ln
- 4518 Marigold Ln