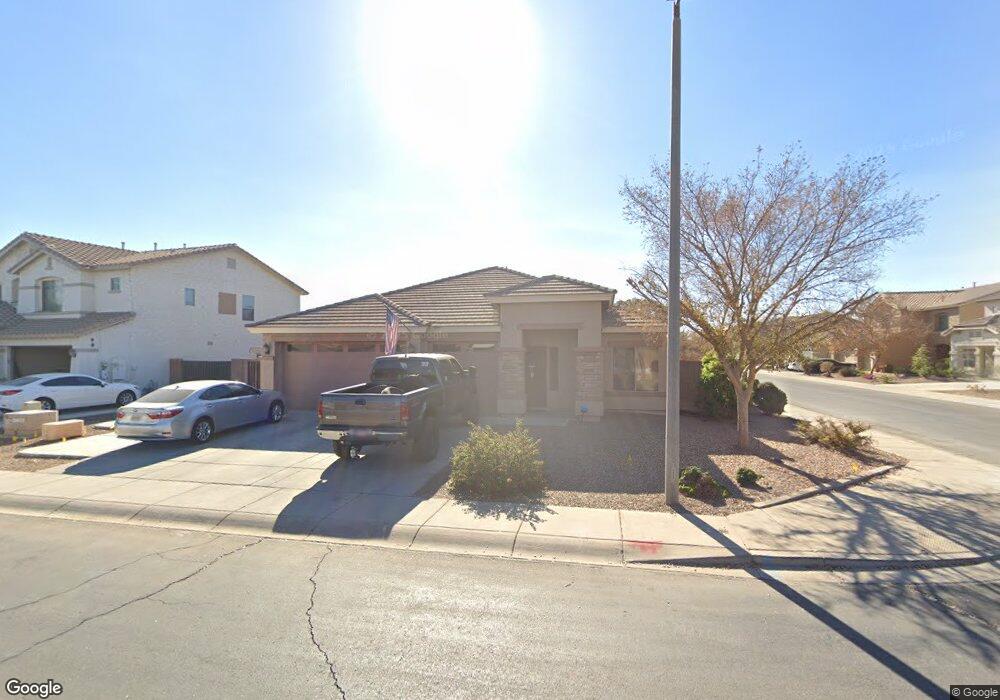
44621 W Rhinestone Rd Maricopa, AZ 85139
Estimated Value: $363,966 - $439,000
3
Beds
2
Baths
2,265
Sq Ft
$180/Sq Ft
Est. Value
About This Home
This home is located at 44621 W Rhinestone Rd, Maricopa, AZ 85139 and is currently estimated at $408,492, approximately $180 per square foot. 44621 W Rhinestone Rd is a home located in Pinal County with nearby schools including Pima Butte Elementary School, Maricopa High School, and Desert Wind Middle School.
Ownership History
Date
Name
Owned For
Owner Type
Purchase Details
Closed on
Sep 5, 2012
Sold by
Pelley Jennifer and Pelley Eric
Bought by
Pelley Jennifer and Pelley Eric
Current Estimated Value
Home Financials for this Owner
Home Financials are based on the most recent Mortgage that was taken out on this home.
Original Mortgage
$134,371
Outstanding Balance
$93,765
Interest Rate
3.75%
Mortgage Type
FHA
Estimated Equity
$314,727
Purchase Details
Closed on
Dec 9, 2009
Sold by
Nowell James H
Bought by
West Jennifer
Home Financials for this Owner
Home Financials are based on the most recent Mortgage that was taken out on this home.
Original Mortgage
$137,464
Interest Rate
5.01%
Mortgage Type
FHA
Purchase Details
Closed on
Mar 26, 2008
Sold by
Fulton Homes Sales Corp
Bought by
Nowell James H
Home Financials for this Owner
Home Financials are based on the most recent Mortgage that was taken out on this home.
Original Mortgage
$188,527
Interest Rate
5.99%
Mortgage Type
New Conventional
Create a Home Valuation Report for This Property
The Home Valuation Report is an in-depth analysis detailing your home's value as well as a comparison with similar homes in the area
Home Values in the Area
Average Home Value in this Area
Purchase History
| Date | Buyer | Sale Price | Title Company |
|---|---|---|---|
| Pelley Jennifer | -- | Lsi Title Company | |
| West Jennifer | $140,000 | Old Republic Title Agency | |
| Nowell James H | $188,527 | The Talon Group | |
| Fulton Homes Sales Corp | $183,079 | The Talon Group |
Source: Public Records
Mortgage History
| Date | Status | Borrower | Loan Amount |
|---|---|---|---|
| Open | Pelley Jennifer | $134,371 | |
| Closed | West Jennifer | $137,464 | |
| Previous Owner | Nowell James H | $188,527 |
Source: Public Records
Tax History Compared to Growth
Tax History
| Year | Tax Paid | Tax Assessment Tax Assessment Total Assessment is a certain percentage of the fair market value that is determined by local assessors to be the total taxable value of land and additions on the property. | Land | Improvement |
|---|---|---|---|---|
| 2025 | $2,254 | $32,674 | -- | -- |
| 2024 | $2,133 | $40,363 | -- | -- |
| 2023 | $2,195 | $26,144 | $2,614 | $23,530 |
| 2022 | $2,133 | $20,932 | $2,614 | $18,318 |
| 2021 | $2,036 | $19,221 | $0 | $0 |
| 2020 | $1,944 | $19,031 | $0 | $0 |
| 2019 | $1,869 | $16,270 | $0 | $0 |
| 2018 | $1,844 | $15,209 | $0 | $0 |
| 2017 | $1,757 | $14,639 | $0 | $0 |
| 2016 | $1,582 | $14,941 | $1,250 | $13,691 |
| 2014 | $1,511 | $9,703 | $1,000 | $8,703 |
Source: Public Records
Map
Nearby Homes
- 21719 N Celtic Ave
- 44538 W Canyon Creek Dr
- 44614 W Bella Trail
- 44517 W Copper Trail
- 44574 W High Desert Trail
- 44566 W High Desert Trail
- 21928 N Braden Rd
- 21412 N Duncan Dr
- 21384 N Duncan Dr
- 43813 W Rio Lobo Dr
- 43822 W Baker Dr
- 43826 W Wade Dr
- 43890 W Bedford Dr
- 44922 W Alamendras St
- 43949 W Sagebrush Trail
- 43727 W Wade Dr
- 21047 N Alma Dr
- 43935 W Sagebrush Trail
- 43710 W Elm Dr
- 22348 N Braden Rd
- 44589 W Rhinestone Rd
- 44620 W Vineyard St
- 44539 W Rhinestone Rd
- 44576 W Vineyard St
- 21876 N Sunset Dr
- 21898 N Sunset Dr
- 21834 N Sunset Dr
- 44620 W Rhinestone Rd
- 44590 W Rhinestone Rd
- 44534 W Vineyard St
- 44487 W Rhinestone Rd
- 21918 N Sunset Dr
- 21814 N Sunset Dr
- 44558 W Rhinestone Rd
- 44522 W Rhinestone Rd
- 21938 N Sunset Dr
- 44467 W Rhinestone Rd
- 44490 W Vineyard St
- 21794 N Sunset Dr
- 44488 W Rhinestone Rd