M
Landlord's Agent in 2024
MARCELENE EDWARDS
Dropped Members
Estimated Value: $239,333
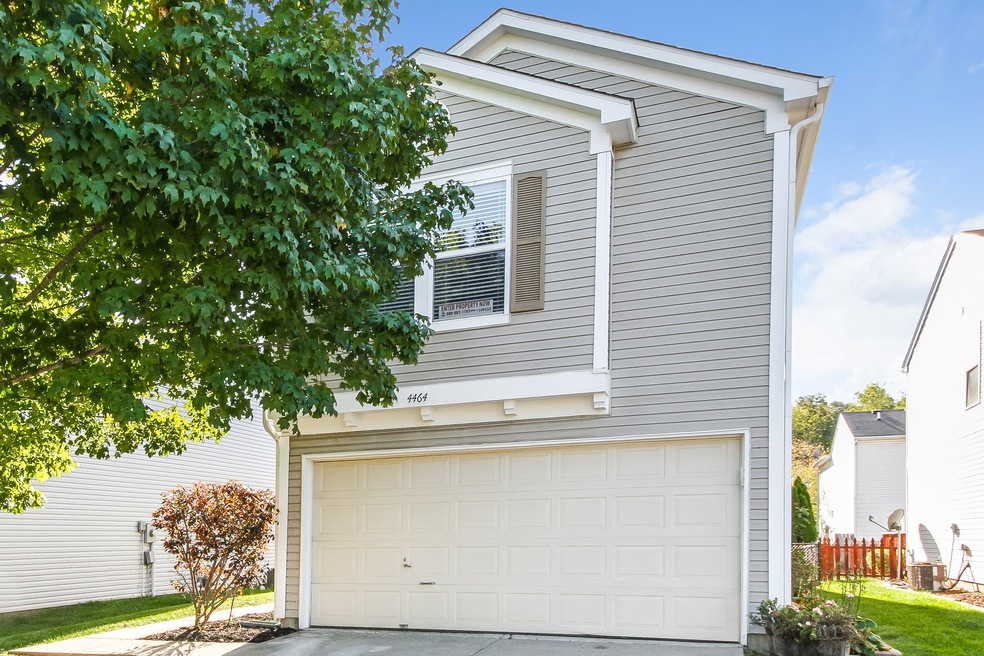
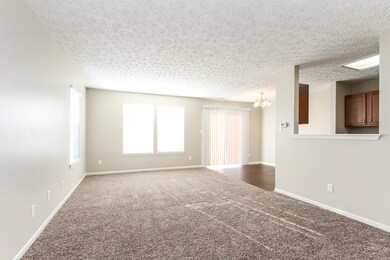
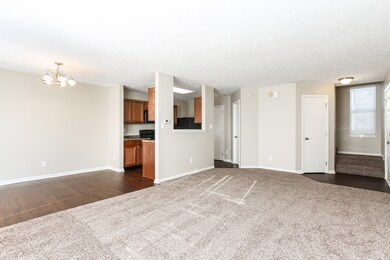
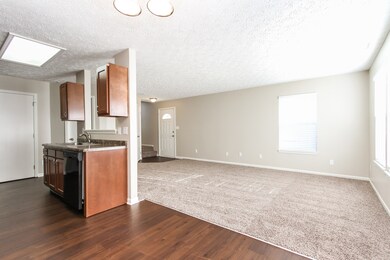
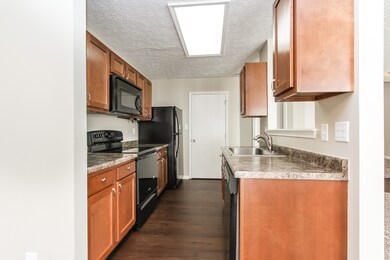
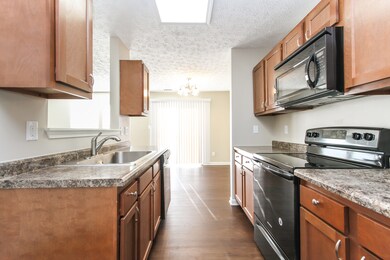
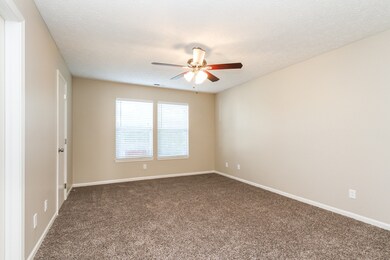
This home features a comfortable layout with good-sized bedrooms and bathrooms, a great kitchen with plenty of counter and cabinet space, many updated and upgraded features, central HVAC and programmable thermostat, garage and a spacious yard, and it's pet friendly.
Last Agent to Rent the Property
MARCELENE EDWARDS
Dropped Members Brokerage Email: customercare@rentprogress.com License #RB16000912 Listed on: 12/05/2023
Last Renter's Agent
MARCELENE EDWARDS
Dropped Members Brokerage Email: customercare@rentprogress.com License #RB16000912 Listed on: 12/05/2023
| Date | Buyer | Sale Price | Title Company |
|---|---|---|---|
| Progress Residential Borrower 4 Llc | -- | None Available | |
| Property Owner 3 Llc | $120,000 | First American Title |
| Date | Event | Price | List to Sale | Price per Sq Ft | Prior Sale |
|---|---|---|---|---|---|
| 01/03/2024 01/03/24 | Rented | $1,745 | 0.0% | -- | |
| 12/26/2023 12/26/23 | Under Contract | -- | -- | -- | |
| 12/20/2023 12/20/23 | Price Changed | $1,745 | -1.1% | $3 / Sq Ft | |
| 12/19/2023 12/19/23 | Price Changed | $1,765 | +0.6% | $3 / Sq Ft | |
| 12/14/2023 12/14/23 | Price Changed | $1,755 | -2.5% | $3 / Sq Ft | |
| 12/13/2023 12/13/23 | Price Changed | $1,800 | -0.3% | $3 / Sq Ft | |
| 12/11/2023 12/11/23 | Price Changed | $1,805 | -0.3% | $3 / Sq Ft | |
| 12/07/2023 12/07/23 | Price Changed | $1,810 | -0.3% | $3 / Sq Ft | |
| 12/05/2023 12/05/23 | For Rent | $1,815 | +16.0% | -- | |
| 12/03/2021 12/03/21 | Rented | -- | -- | -- | |
| 11/29/2021 11/29/21 | Under Contract | -- | -- | -- | |
| 11/04/2021 11/04/21 | For Rent | $1,565 | 0.0% | -- | |
| 09/06/2017 09/06/17 | Sold | $120,000 | 0.0% | $80 / Sq Ft | View Prior Sale |
| 08/03/2017 08/03/17 | Pending | -- | -- | -- | |
| 07/31/2017 07/31/17 | For Sale | $120,000 | -- | $80 / Sq Ft |
| Year | Tax Paid | Tax Assessment Tax Assessment Total Assessment is a certain percentage of the fair market value that is determined by local assessors to be the total taxable value of land and additions on the property. | Land | Improvement |
|---|---|---|---|---|
| 2025 | $3,132 | $168,300 | $48,000 | $120,300 |
| 2024 | $3,132 | $161,500 | $26,900 | $134,600 |
| 2023 | $3,125 | $156,800 | $25,600 | $131,200 |
| 2022 | $3,010 | $150,500 | $24,600 | $125,900 |
| 2021 | $2,648 | $132,400 | $23,200 | $109,200 |
| 2020 | $2,474 | $123,700 | $23,200 | $100,500 |
| 2019 | $2,338 | $116,900 | $22,000 | $94,900 |
| 2018 | $2,242 | $112,100 | $22,000 | $90,100 |
| 2017 | $649 | $97,900 | $21,600 | $76,300 |
| 2016 | $614 | $95,400 | $21,600 | $73,800 |
| 2014 | $576 | $91,300 | $20,000 | $71,300 |
M
Landlord's Agent in 2024
MARCELENE EDWARDS
Dropped Members

Seller's Agent in 2017
Morgan Lathery
Keller Williams Indy Metro S
(317) 210-1126
9 in this area
132 Total Sales
D
Seller Co-Listing Agent in 2017
Douglas Lathery
Dropped Members
M
Buyer's Agent in 2017
Melissa Stanifer
Stanifer & Associates Real Est
Source: MIBOR Broker Listing Cooperative®
MLS Number: 21955730
APN: 32-10-28-480-008.000-012
Disclaimer: Certain information contained herein is derived from information provided by parties other than Homes.com. All information provided is deemed reliable, but is not guaranteed to be accurate and should be independently verified.
![]() Based on information submitted to the MLS GRID. All data is obtained from various sources and may not have been verified by broker or MLS GRID. Supplied Open House Information is subject to change without notice. All information should be independently reviewed and verified for accuracy. Properties may or may not be listed by the office/agent presenting the information. Some IDX listings have been excluded from this website.
Based on information submitted to the MLS GRID. All data is obtained from various sources and may not have been verified by broker or MLS GRID. Supplied Open House Information is subject to change without notice. All information should be independently reviewed and verified for accuracy. Properties may or may not be listed by the office/agent presenting the information. Some IDX listings have been excluded from this website.
Based on information submitted to the MLS GRID
Ask me questions while you tour the home.