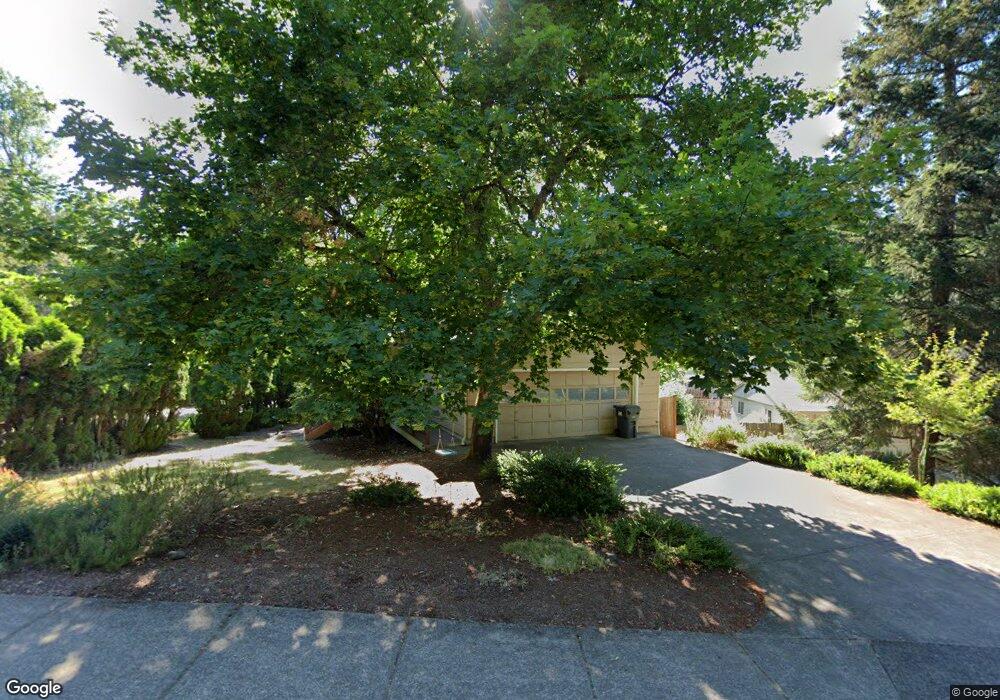
4465 N Shasta Loop Eugene, OR 97405
Southeast Eugene NeighborhoodEstimated Value: $521,269 - $626,000
3
Beds
3
Baths
1,340
Sq Ft
$415/Sq Ft
Est. Value
About This Home
This home is located at 4465 N Shasta Loop, Eugene, OR 97405 and is currently estimated at $555,567, approximately $414 per square foot. 4465 N Shasta Loop is a home located in Lane County with nearby schools including Edgewood Community Elementary School, Spencer Butte Middle School, and South Eugene High School.
Ownership History
Date
Name
Owned For
Owner Type
Purchase Details
Closed on
Apr 26, 2017
Sold by
Jecklin Andrew A and Bambrey Jecklin Tara
Bought by
Bambrey Jecklin Tara
Current Estimated Value
Purchase Details
Closed on
Mar 14, 2002
Sold by
Washington Mutual Bank
Bought by
Jecklin Andrew A and Bambrey Jecklin Tara
Home Financials for this Owner
Home Financials are based on the most recent Mortgage that was taken out on this home.
Original Mortgage
$143,000
Outstanding Balance
$58,251
Interest Rate
6.85%
Estimated Equity
$497,316
Purchase Details
Closed on
Nov 27, 2001
Sold by
Machado Frank Robert and Machado Christine Carole
Bought by
Washington Mutual Bank
Purchase Details
Closed on
Apr 10, 1998
Sold by
Housinger Irvin W
Bought by
Machado Frank Robert and Machado Christine Carole
Home Financials for this Owner
Home Financials are based on the most recent Mortgage that was taken out on this home.
Original Mortgage
$111,550
Interest Rate
7.07%
Create a Home Valuation Report for This Property
The Home Valuation Report is an in-depth analysis detailing your home's value as well as a comparison with similar homes in the area
Home Values in the Area
Average Home Value in this Area
Purchase History
| Date | Buyer | Sale Price | Title Company |
|---|---|---|---|
| Bambrey Jecklin Tara | -- | None Available | |
| Jecklin Andrew A | $152,000 | Fidelity National Title Ins | |
| Washington Mutual Bank | $151,167 | Fidelity National Title Ins | |
| Machado Frank Robert | $115,000 | Title Guaranty Co |
Source: Public Records
Mortgage History
| Date | Status | Borrower | Loan Amount |
|---|---|---|---|
| Open | Jecklin Andrew A | $143,000 | |
| Previous Owner | Machado Frank Robert | $111,550 |
Source: Public Records
Tax History
| Year | Tax Paid | Tax Assessment Tax Assessment Total Assessment is a certain percentage of the fair market value that is determined by local assessors to be the total taxable value of land and additions on the property. | Land | Improvement |
|---|---|---|---|---|
| 2025 | $4,802 | $246,474 | -- | -- |
| 2024 | $4,743 | $239,296 | -- | -- |
| 2023 | $4,743 | $232,327 | $0 | $0 |
| 2022 | $4,342 | $220,457 | $0 | $0 |
| 2021 | $4,079 | $214,036 | $0 | $0 |
| 2020 | $4,093 | $207,802 | $0 | $0 |
| 2019 | $3,953 | $201,750 | $0 | $0 |
| 2018 | $3,721 | $190,169 | $0 | $0 |
| 2017 | $3,554 | $190,169 | $0 | $0 |
| 2016 | $3,466 | $184,630 | $0 | $0 |
| 2015 | $3,367 | $179,252 | $0 | $0 |
| 2014 | $3,299 | $174,031 | $0 | $0 |
Source: Public Records
Map
Nearby Homes
- 1755 E 43rd Ave
- 4835 Elva Ln
- 0 Wendell Ln Unit 200453475
- 0 Wendell Ln Unit 279865930
- 0 Wendell Ln Unit 1
- 1865 E 43rd Ave
- 1862 E 43rd Ave
- 0 N Shasta Loop Unit 384285834
- 2015 E 43rd Ave
- 0 Why Worry Ln
- 4015 Spring Knoll Dr
- 4080 Spring Blvd
- 3945 Spring Blvd
- 1210 E 38th Ave
- 3790 Onyx St
- 4429 Fox Hollow Rd Unit 3
- 910 E 43rd Ave
- 4733 E Amazon Dr
- 4364 Fox Hollow Rd
- 4320 Fox Hollow Rd
- 4455 N Shasta Loop
- 4285 N Shasta Loop
- 4485 N Shasta Loop
- 4405 N Shasta Loop
- 4425 N Shasta Loop
- 1690 Leatherwood Dr
- 1680 Leatherwood Dr
- 1670 Leatherwood Dr
- 4445 N Shasta Loop
- 4395 N Shasta Loop
- 0 Leatherwood Dr
- 1660 Leatherwood Dr
- 4392 N Shasta Loop
- 1765 E 43rd Ave
- 4393 N Shasta Loop
- 1630 Leatherwood Dr
- 1732 E 43rd Ave
- 0 E 43rd Ave Unit 20150107
- 0 E 43rd Ave
- 1754 E 43rd Ave
Your Personal Tour Guide
Ask me questions while you tour the home.