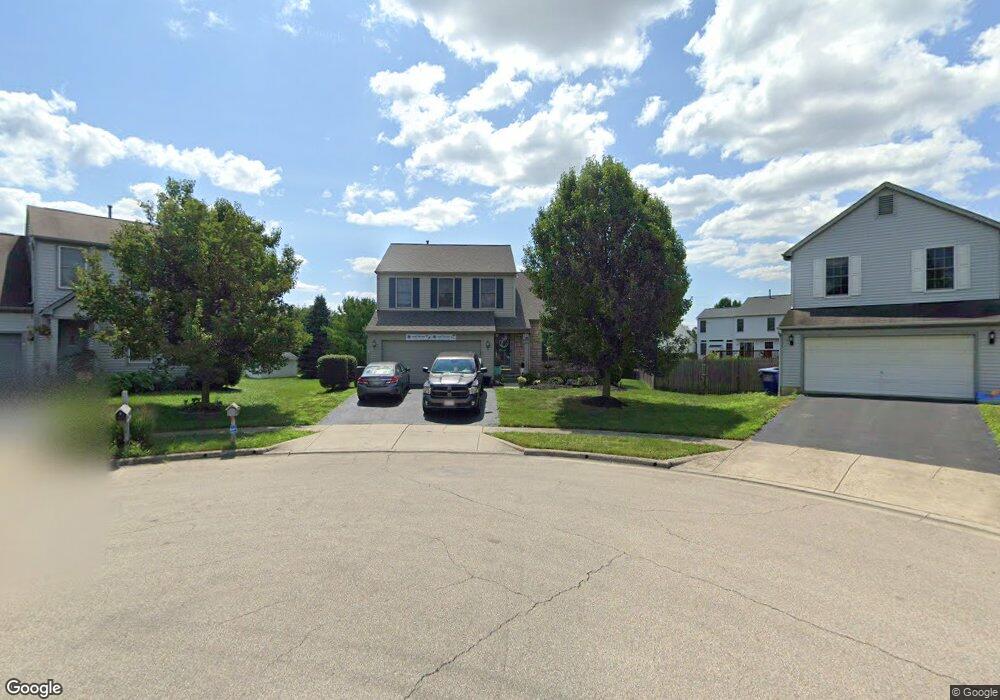
4467 Canaday Ct Columbus, OH 43228
Trabue Woods NeighborhoodEstimated Value: $366,153 - $394,000
3
Beds
3
Baths
1,856
Sq Ft
$202/Sq Ft
Est. Value
About This Home
This home is located at 4467 Canaday Ct, Columbus, OH 43228 and is currently estimated at $374,788, approximately $201 per square foot. 4467 Canaday Ct is a home located in Franklin County with nearby schools including Hilliard Horizon Elementary School, Hilliard Station Sixth Grade Elementary School, and Hilliard Heritage Middle School.
Ownership History
Date
Name
Owned For
Owner Type
Purchase Details
Closed on
Jul 3, 2013
Sold by
Frazer Bryan H
Bought by
Frazer Bryan H and Frazer Brandi L
Current Estimated Value
Purchase Details
Closed on
Jul 29, 2005
Sold by
Neininger Thomas M and Neininger Michelle L
Bought by
Frazer Bryan H
Home Financials for this Owner
Home Financials are based on the most recent Mortgage that was taken out on this home.
Original Mortgage
$140,800
Outstanding Balance
$74,960
Interest Rate
5.87%
Mortgage Type
Fannie Mae Freddie Mac
Estimated Equity
$299,828
Purchase Details
Closed on
May 10, 2001
Sold by
Dominion Homes Inc
Bought by
Neininger Thomas M and Farrell Michelle
Home Financials for this Owner
Home Financials are based on the most recent Mortgage that was taken out on this home.
Original Mortgage
$192,374
Interest Rate
6.99%
Mortgage Type
FHA
Create a Home Valuation Report for This Property
The Home Valuation Report is an in-depth analysis detailing your home's value as well as a comparison with similar homes in the area
Home Values in the Area
Average Home Value in this Area
Purchase History
| Date | Buyer | Sale Price | Title Company |
|---|---|---|---|
| Frazer Bryan H | -- | None Available | |
| Frazer Bryan H | $176,000 | Hostetler B | |
| Neininger Thomas M | $194,000 | Alliance Title |
Source: Public Records
Mortgage History
| Date | Status | Borrower | Loan Amount |
|---|---|---|---|
| Open | Frazer Bryan H | $140,800 | |
| Previous Owner | Neininger Thomas M | $192,374 |
Source: Public Records
Tax History Compared to Growth
Tax History
| Year | Tax Paid | Tax Assessment Tax Assessment Total Assessment is a certain percentage of the fair market value that is determined by local assessors to be the total taxable value of land and additions on the property. | Land | Improvement |
|---|---|---|---|---|
| 2024 | $6,558 | $113,680 | $30,520 | $83,160 |
| 2023 | $5,702 | $113,680 | $30,520 | $83,160 |
| 2022 | $4,624 | $73,790 | $13,130 | $60,660 |
| 2021 | $4,619 | $73,790 | $13,130 | $60,660 |
| 2020 | $4,607 | $73,790 | $13,130 | $60,660 |
| 2019 | $4,231 | $57,860 | $10,500 | $47,360 |
| 2018 | $4,116 | $57,860 | $10,500 | $47,360 |
| 2017 | $4,216 | $57,860 | $10,500 | $47,360 |
| 2016 | $4,277 | $54,360 | $10,290 | $44,070 |
| 2015 | $4,017 | $54,360 | $10,290 | $44,070 |
| 2014 | $4,024 | $54,360 | $10,290 | $44,070 |
| 2013 | $2,038 | $54,355 | $10,290 | $44,065 |
Source: Public Records
Map
Nearby Homes
- 4451 Sherwill Rd
- 1175 Onaway Ct
- 4000 Sandy Ridge Dr
- 4589 Annhurst Rd
- 3761 Gibbstone Dr
- 3757 Gibbstone Dr
- 3664 Grimes Dr
- 3570 Dover Rd
- 271 Carilla Ln
- 450 Lawrence Ave
- 1024 Hartford Village Blvd Unit 1024
- 218 Darbyhurst Rd
- 316 Sturbridge Rd
- 1152 Kinneton Unit 1152
- 960 Hartford Village Blvd
- 952 Hartford Village Blvd Unit 952
- 141 Beacon Run W Unit 26E
- 3495 La Coste Ln
- 1652 Bennigan Dr Unit 175A
- 4696 Tarryton Ct S Unit 7-2D
- 4473 Canaday Ct
- 4473 Canaday Ct Unit 339
- 4460 Canaday Ct
- 4474 Nickerson Rd
- 4480 Nickerson Rd
- 4468 Nickerson Rd
- 4486 Nickerson Rd
- 1323 Laforge St
- 1331 Laforge St
- 4479 Canaday Ct
- 4462 Nickerson Rd
- 1337 Laforge St
- 4466 Canaday Ct
- 4492 Nickerson Rd
- 4492 Nickerson Rd Unit 293
- 4485 Canaday Ct
- 4485 Canaday Ct Unit 341
- 4456 Nickerson Rd
- 4472 Canaday Ct
- 1343 Laforge St