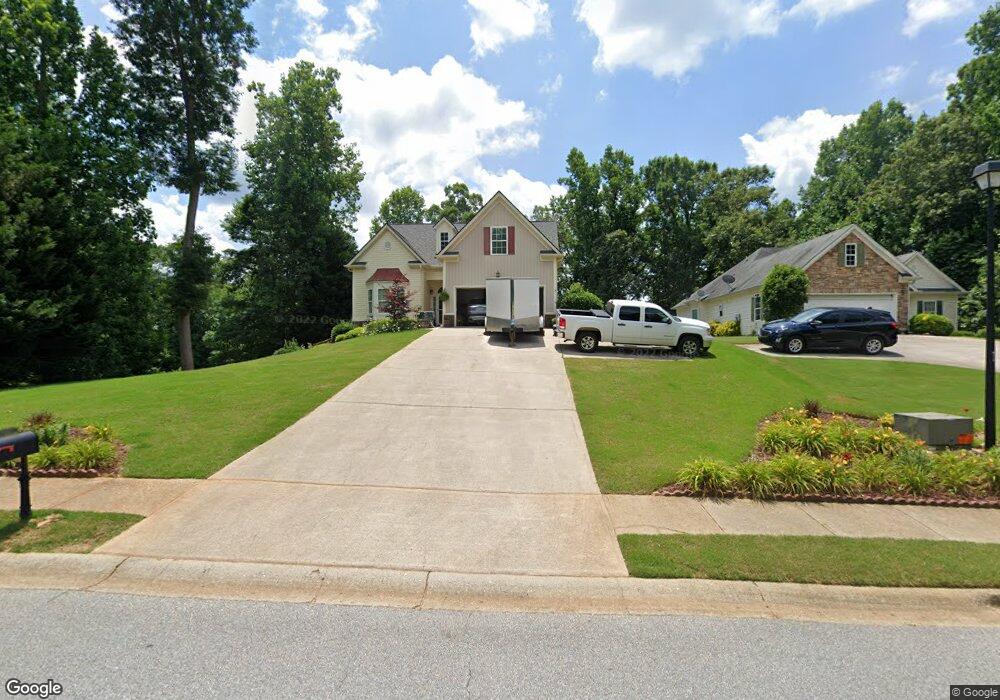
4467 Enfield Dr Gainesville, GA 30506
Estimated Value: $389,923 - $464,000
3
Beds
2
Baths
2,072
Sq Ft
$205/Sq Ft
Est. Value
About This Home
This home is located at 4467 Enfield Dr, Gainesville, GA 30506 and is currently estimated at $425,481, approximately $205 per square foot. 4467 Enfield Dr is a home located in Hall County with nearby schools including Lanier Elementary School, Chestatee Middle School, and Chestatee High School.
Ownership History
Date
Name
Owned For
Owner Type
Purchase Details
Closed on
Oct 8, 2019
Sold by
Dell T John
Bought by
Dell Timothy John and Dell Debra W
Current Estimated Value
Home Financials for this Owner
Home Financials are based on the most recent Mortgage that was taken out on this home.
Original Mortgage
$134,000
Outstanding Balance
$51,614
Interest Rate
3.5%
Mortgage Type
New Conventional
Estimated Equity
$373,867
Purchase Details
Closed on
Jul 22, 2005
Sold by
Renaissance Construction Group I
Bought by
Dell Dell T and Dell Debra
Home Financials for this Owner
Home Financials are based on the most recent Mortgage that was taken out on this home.
Original Mortgage
$164,000
Interest Rate
5.57%
Mortgage Type
New Conventional
Purchase Details
Closed on
Oct 2, 2003
Sold by
Dc&L Sardis Llc
Bought by
Renaissance Construction Group Inc
Purchase Details
Closed on
Oct 1, 2003
Sold by
Highway 53 Properties Inc
Bought by
Dc&L Sardis Llc
Create a Home Valuation Report for This Property
The Home Valuation Report is an in-depth analysis detailing your home's value as well as a comparison with similar homes in the area
Home Values in the Area
Average Home Value in this Area
Purchase History
| Date | Buyer | Sale Price | Title Company |
|---|---|---|---|
| Dell Timothy John | -- | -- | |
| Dell Dell T | $194,000 | -- | |
| Renaissance Construction Group Inc | $97,500 | -- | |
| Dc&L Sardis Llc | $283,500 | -- |
Source: Public Records
Mortgage History
| Date | Status | Borrower | Loan Amount |
|---|---|---|---|
| Open | Dell Timothy John | $134,000 | |
| Previous Owner | Dell Dell T | $164,000 |
Source: Public Records
Tax History Compared to Growth
Tax History
| Year | Tax Paid | Tax Assessment Tax Assessment Total Assessment is a certain percentage of the fair market value that is determined by local assessors to be the total taxable value of land and additions on the property. | Land | Improvement |
|---|---|---|---|---|
| 2024 | $1,437 | $161,920 | $28,320 | $133,600 |
| 2023 | $3,064 | $154,640 | $30,640 | $124,000 |
| 2022 | $2,667 | $159,080 | $29,000 | $130,080 |
| 2021 | $2,723 | $118,320 | $12,640 | $105,680 |
| 2020 | $2,645 | $111,960 | $12,640 | $99,320 |
| 2019 | $2,513 | $106,160 | $12,640 | $93,520 |
| 2018 | $2,414 | $99,960 | $10,520 | $89,440 |
| 2017 | $2,623 | $90,240 | $10,520 | $79,720 |
| 2016 | $2,563 | $90,240 | $10,520 | $79,720 |
| 2015 | $2,366 | $84,040 | $8,440 | $75,600 |
| 2014 | $2,366 | $82,440 | $6,840 | $75,600 |
Source: Public Records
Map
Nearby Homes
- 4606 Enfield Dr
- 4704 Hanson Hills Ct
- 4135 Cha Co Rd
- 4722 Middleboro Ln
- 4506 Old Princeton Ridge Unit 1
- 4522 Old Princeton Ridge
- 4409 Waterman Dr
- 3286 High View Ct
- 3292 High View Ct
- 4340 Oak Creek Dr
- 4232 Green Valley Dr
- 4363 Sardis Rd
- 4466 Sardis Dr
- 4312 Green Hill Rd
- 3579 Sequoia Rd
- 4051 Hidden Hollow Dr Unit A
- 4471 Enfield Dr Unit 2
- 4640 Middleboro Ln
- 4463 Enfield Dr
- 4475 Enfield Dr
- 0 Middleboro Ln Unit 8490371
- 0 Middleboro Ln Unit 8758131
- 0 Middleboro Ln Unit 8829811
- 0 Middleboro Ln Unit 3133592
- 0 Middleboro Ln Unit 3240622
- 0 Middleboro Ln Unit 7079372
- 0 Middleboro Ln Unit 7093313
- 0 Middleboro Ln Unit 8252583
- 4654 Middleboro Ln
- 4466 Enfield Dr Unit 2
- 4459 Enfield Dr Unit 2
- 4479 Enfield Dr Unit 2
- 4454 Enfield Dr
- 4645 Middleboro Ln
- 4660 Middleboro Ln
- 4653 Middleboro Ln