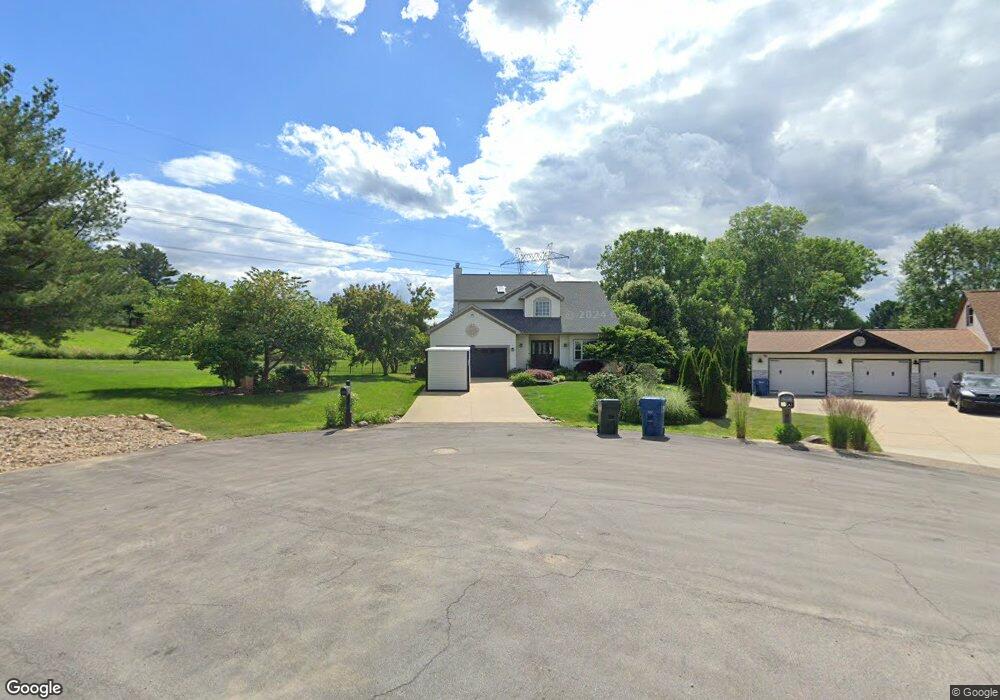
4468 Jolly Cir Uniontown, OH 44685
Estimated Value: $381,000 - $433,000
3
Beds
3
Baths
2,368
Sq Ft
$172/Sq Ft
Est. Value
About This Home
This home is located at 4468 Jolly Cir, Uniontown, OH 44685 and is currently estimated at $406,175, approximately $171 per square foot. 4468 Jolly Cir is a home located in Summit County with nearby schools including Greenwood Elementary School, Green Intermediate Elementary School, and Green Primary School.
Ownership History
Date
Name
Owned For
Owner Type
Purchase Details
Closed on
Jun 7, 2017
Sold by
Ray Jeremy M
Bought by
Vance Tara L
Current Estimated Value
Purchase Details
Closed on
Dec 28, 2009
Sold by
Rayl Deborah D
Bought by
Rayl Jeremy M and Vance Iaral L
Purchase Details
Closed on
Jun 16, 2004
Sold by
Bank One Na
Bought by
Rayl Deborah D
Home Financials for this Owner
Home Financials are based on the most recent Mortgage that was taken out on this home.
Original Mortgage
$109,900
Interest Rate
6.17%
Mortgage Type
Purchase Money Mortgage
Purchase Details
Closed on
Mar 8, 2004
Sold by
Mihal Catherine
Bought by
Bank One Na
Purchase Details
Closed on
Dec 9, 1998
Sold by
Lloyd Bruce R and Lloyd Dina A
Bought by
Murphy Ralph D
Home Financials for this Owner
Home Financials are based on the most recent Mortgage that was taken out on this home.
Original Mortgage
$128,800
Interest Rate
6.93%
Mortgage Type
Purchase Money Mortgage
Create a Home Valuation Report for This Property
The Home Valuation Report is an in-depth analysis detailing your home's value as well as a comparison with similar homes in the area
Home Values in the Area
Average Home Value in this Area
Purchase History
| Date | Buyer | Sale Price | Title Company |
|---|---|---|---|
| Vance Tara L | -- | None Available | |
| Rayl Jeremy M | -- | None Available | |
| Rayl Deborah D | $179,900 | Sovereign Title Agency Llc | |
| Bank One Na | $140,250 | -- | |
| Murphy Ralph D | $161,000 | -- |
Source: Public Records
Mortgage History
| Date | Status | Borrower | Loan Amount |
|---|---|---|---|
| Previous Owner | Rayl Deborah D | $109,900 | |
| Previous Owner | Murphy Ralph D | $128,800 | |
| Closed | Rayl Deborah D | $70,000 |
Source: Public Records
Tax History Compared to Growth
Tax History
| Year | Tax Paid | Tax Assessment Tax Assessment Total Assessment is a certain percentage of the fair market value that is determined by local assessors to be the total taxable value of land and additions on the property. | Land | Improvement |
|---|---|---|---|---|
| 2025 | $6,005 | $126,946 | $24,287 | $102,659 |
| 2024 | $6,005 | $126,946 | $24,287 | $102,659 |
| 2023 | $6,005 | $126,946 | $24,287 | $102,659 |
| 2022 | $4,805 | $91,064 | $17,350 | $73,714 |
| 2021 | $4,507 | $91,064 | $17,350 | $73,714 |
| 2020 | $4,421 | $91,060 | $17,350 | $73,710 |
| 2019 | $4,222 | $81,450 | $14,330 | $67,120 |
| 2018 | $4,315 | $81,450 | $14,330 | $67,120 |
| 2017 | $3,692 | $81,450 | $14,330 | $67,120 |
| 2016 | $3,774 | $67,060 | $14,330 | $52,730 |
| 2015 | $3,692 | $65,260 | $14,330 | $50,930 |
| 2014 | $3,117 | $55,270 | $14,330 | $40,940 |
| 2013 | $3,256 | $57,410 | $14,330 | $43,080 |
Source: Public Records
Map
Nearby Homes
- 1499 King Dr
- 4426 Royce Ave
- 1659 King Dr
- 4440 Shriver Rd
- 4350 Sunnyview Dr
- 1425 Hazeldell Dr
- 4301 Evergreen Ct Unit 63
- 4324 Evergreen Ct Unit 53
- 4317 Evergreen Ct Unit 67
- Allegheny Plan at Stoney Creek
- Lehigh Plan at Stoney Creek
- Hudson Plan at Stoney Creek
- Columbia Plan at Stoney Creek
- Aviano Plan at Stoney Creek
- 4237 Springdale Rd
- 4384 Massillon Rd
- V/L Massillon Rd
- 4909 Timbercreek Cir
- 1501 Spring Wood Ln
- 4870 Firwood Dr
- 4460 Jolly Cir
- 4467 Jolly Cir
- 1527 King Dr
- 4459 Jolly Cir
- 1526 Melanie Dr
- 1516 Melanie Dr
- 1506 Melanie Dr
- 1542 Melanie Dr
- 1347 King Dr
- 1552 Melanie Dr
- 1547 King Dr
- 0 Jolly Cir Unit 3983864
- 0 Jolly Cir Unit 4094329
- V/L Melanie Dr
- 4474 Rayel Cir
- 4466 Rayel Cir
- 1486 Melanie Dr
- 1562 Melanie Dr
- 1561 King Dr
- 1522 King Dr