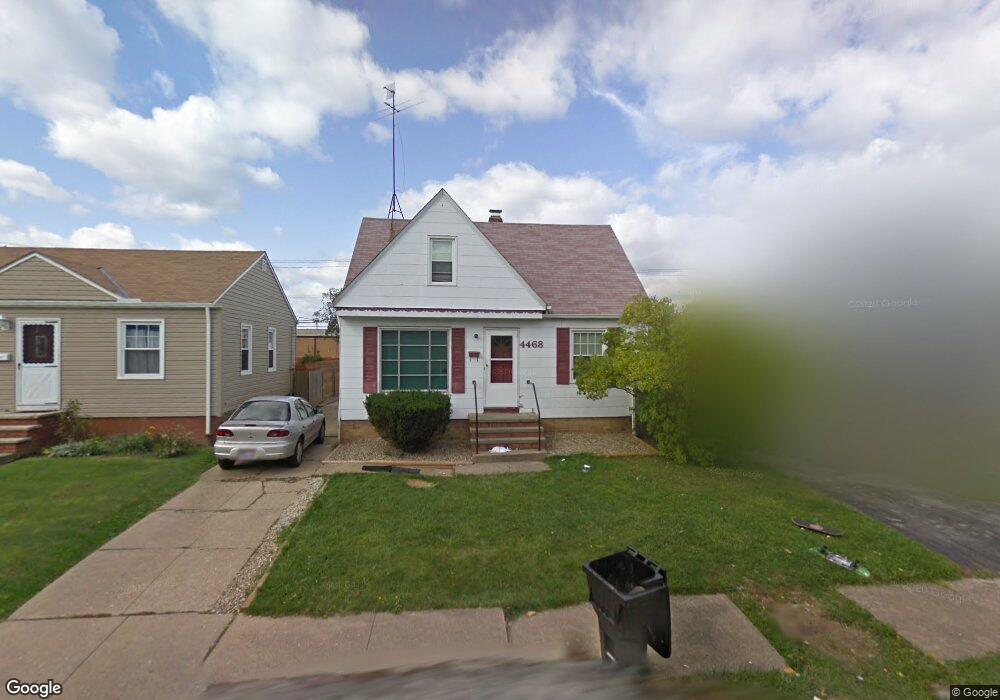
4468 W 140th St Cleveland, OH 44135
Bellaire-Puritas NeighborhoodEstimated Value: $120,238 - $139,000
4
Beds
1
Bath
1,145
Sq Ft
$114/Sq Ft
Est. Value
About This Home
This home is located at 4468 W 140th St, Cleveland, OH 44135 and is currently estimated at $130,060, approximately $113 per square foot. 4468 W 140th St is a home located in Cuyahoga County with nearby schools including Artemus Ward School, Almira Academy, and Benjamin Franklin.
Ownership History
Date
Name
Owned For
Owner Type
Purchase Details
Closed on
Mar 23, 2020
Sold by
Rosebuds And Dreams Llc
Bought by
Rosebuds And Dreams Properties Llc
Current Estimated Value
Home Financials for this Owner
Home Financials are based on the most recent Mortgage that was taken out on this home.
Original Mortgage
$1,051,000
Outstanding Balance
$921,757
Interest Rate
3%
Mortgage Type
Commercial
Estimated Equity
-$791,697
Purchase Details
Closed on
Aug 21, 2015
Sold by
Keefe Raymond E
Bought by
Rosebuds & Dreams Llc
Purchase Details
Closed on
Nov 8, 2012
Sold by
Budin Sharon A and Budin Dereck M
Bought by
Keefe Raymond E
Purchase Details
Closed on
Nov 7, 2012
Sold by
Carman Jeanne M and Carman Jeannie M
Bought by
Keefe Raymond E
Purchase Details
Closed on
May 31, 1989
Sold by
Chandler Roger L
Bought by
Keefe Raymond E
Purchase Details
Closed on
Sep 11, 1979
Sold by
Paul Ernest T and Paul Wilma
Bought by
Chandler Roger L
Purchase Details
Closed on
Jan 1, 1975
Bought by
Paul Ernest T and Paul Wilma
Create a Home Valuation Report for This Property
The Home Valuation Report is an in-depth analysis detailing your home's value as well as a comparison with similar homes in the area
Home Values in the Area
Average Home Value in this Area
Purchase History
| Date | Buyer | Sale Price | Title Company |
|---|---|---|---|
| Rosebuds And Dreams Properties Llc | -- | None Available | |
| Rosebuds & Dreams Llc | $9,616 | Attorney | |
| Keefe Raymond E | -- | Attorney | |
| Keefe Raymond E | -- | Attorney | |
| Keefe Raymond E | $48,000 | -- | |
| Chandler Roger L | $29,000 | -- | |
| Paul Ernest T | -- | -- |
Source: Public Records
Mortgage History
| Date | Status | Borrower | Loan Amount |
|---|---|---|---|
| Open | Rosebuds And Dreams Properties Llc | $1,051,000 |
Source: Public Records
Tax History Compared to Growth
Tax History
| Year | Tax Paid | Tax Assessment Tax Assessment Total Assessment is a certain percentage of the fair market value that is determined by local assessors to be the total taxable value of land and additions on the property. | Land | Improvement |
|---|---|---|---|---|
| 2024 | $2,088 | $31,220 | $7,280 | $23,940 |
| 2023 | $1,488 | $19,190 | $4,870 | $14,320 |
| 2022 | $1,479 | $19,180 | $4,870 | $14,320 |
| 2021 | $1,465 | $19,180 | $4,870 | $14,320 |
| 2020 | $1,314 | $14,880 | $3,780 | $11,100 |
| 2019 | $1,217 | $42,500 | $10,800 | $31,700 |
| 2018 | $1,288 | $14,880 | $3,780 | $11,100 |
| 2017 | $1,374 | $16,250 | $3,470 | $12,780 |
| 2016 | $1,363 | $16,250 | $3,470 | $12,780 |
| 2015 | $1,486 | $16,250 | $3,470 | $12,780 |
| 2014 | $1,486 | $17,640 | $3,780 | $13,860 |
Source: Public Records
Map
Nearby Homes
- 4407 W 140th St
- 13401 Puritas Ave
- 13410 Wainfleet Ave
- 13410 Gilmore Ave
- 4497 W 147th St
- 4349 W 132nd St
- 13514 Bennington Ave
- 13104 Wainfleet Ave
- 13210 Carrington Ave
- 4329 W 131st St
- 13501 Astor Ave
- 4484 W 149th St
- 12923 Lena Ave
- 13904 Highlandview Ave
- 14511 Saint James Ave
- 13402 Saint James Ave
- 13313 Highlandview Ave
- 4162 Victory Blvd
- 13104 Astor Ave
- 4688 W 148th St
- 4472 W 140th St
- 4464 W 140th St
- 4476 W 140th St
- 4480 W 140th St
- 4484 W 140th St
- 4467 W 140th St
- 4463 W 140th St
- 4461 W 140th St
- 4475 W 140th St
- 4479 W 140th St
- 4488 W 140th St
- 4483 W 140th St
- 4492 W 140th St
- 4487 W 140th St
- 4496 W 140th St
- 4468 W 139th St
- 4464 W 139th St
- 4472 W 139th St
- 13915 Puritas Ave
- 4491 W 140th St