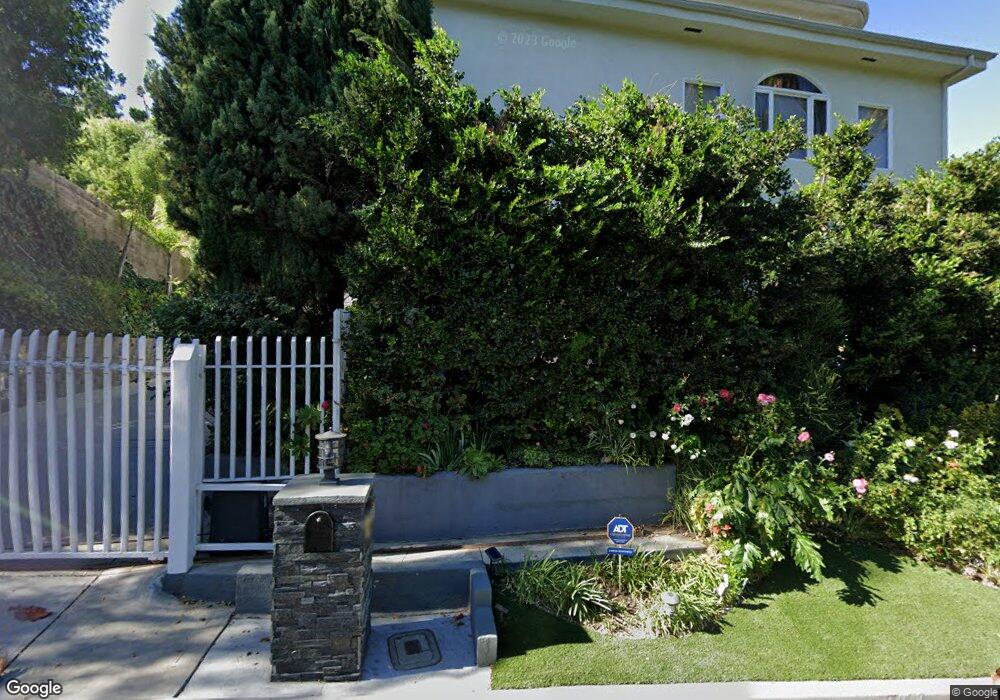
4469 Alonzo Ave Encino, CA 91316
Estimated Value: $2,777,008 - $3,452,000
5
Beds
4
Baths
4,000
Sq Ft
$765/Sq Ft
Est. Value
About This Home
This home is located at 4469 Alonzo Ave, Encino, CA 91316 and is currently estimated at $3,061,502, approximately $765 per square foot. 4469 Alonzo Ave is a home located in Los Angeles County with nearby schools including Gaspar De Portola Middle School, Nestle Avenue Charter, and Encino Charter Elementary.
Ownership History
Date
Name
Owned For
Owner Type
Purchase Details
Closed on
May 22, 2009
Sold by
Maslo Ted and Maslo Janina
Bought by
Maslo Ted and Maslo Janina
Current Estimated Value
Home Financials for this Owner
Home Financials are based on the most recent Mortgage that was taken out on this home.
Original Mortgage
$265,000
Outstanding Balance
$166,982
Interest Rate
4.8%
Mortgage Type
New Conventional
Estimated Equity
$2,894,520
Purchase Details
Closed on
Jun 26, 2003
Sold by
Maslo Ted and Maslo Janina
Bought by
Maslo Ted and Maslo Janina
Purchase Details
Closed on
Jun 27, 2000
Sold by
Conrad Christian R
Bought by
Bonelli William R
Purchase Details
Closed on
Jun 12, 2000
Sold by
Conrad Pamela R
Bought by
Conrad Christian R
Purchase Details
Closed on
May 24, 2000
Sold by
Guaranty Federal Bank Fsb
Bought by
Bonelli William R and Conrad Christian R
Purchase Details
Closed on
Jun 15, 1999
Sold by
Abrams Bobby and Abrams Ilene A
Bought by
Guaranty Federal Bank Fsb
Create a Home Valuation Report for This Property
The Home Valuation Report is an in-depth analysis detailing your home's value as well as a comparison with similar homes in the area
Home Values in the Area
Average Home Value in this Area
Purchase History
| Date | Buyer | Sale Price | Title Company |
|---|---|---|---|
| Maslo Ted | -- | Ticor Title | |
| Maslo Ted | -- | Ticor Title | |
| Maslo Ted | -- | -- | |
| Bonelli William R | -- | -- | |
| Conrad Christian R | -- | Chicago Title Co | |
| Bonelli William R | $550,000 | Chicago Title Co | |
| Guaranty Federal Bank Fsb | $600,000 | Fidelity National Title Ins |
Source: Public Records
Mortgage History
| Date | Status | Borrower | Loan Amount |
|---|---|---|---|
| Open | Maslo Ted | $265,000 |
Source: Public Records
Tax History Compared to Growth
Tax History
| Year | Tax Paid | Tax Assessment Tax Assessment Total Assessment is a certain percentage of the fair market value that is determined by local assessors to be the total taxable value of land and additions on the property. | Land | Improvement |
|---|---|---|---|---|
| 2025 | $17,464 | $1,438,695 | $859,485 | $579,210 |
| 2024 | $17,464 | $1,410,486 | $842,633 | $567,853 |
| 2023 | $17,128 | $1,382,830 | $826,111 | $556,719 |
| 2022 | $16,356 | $1,355,716 | $809,913 | $545,803 |
| 2021 | $16,137 | $1,329,134 | $794,033 | $535,101 |
| 2019 | $15,655 | $1,289,714 | $770,483 | $519,231 |
| 2018 | $15,555 | $1,264,426 | $755,376 | $509,050 |
| 2016 | $14,826 | $1,215,329 | $726,045 | $489,284 |
| 2015 | $14,610 | $1,197,075 | $715,140 | $481,935 |
| 2014 | $14,659 | $1,173,627 | $701,132 | $472,495 |
Source: Public Records
Map
Nearby Homes
- 4406 Medley Place
- 4326 Coronet Dr
- 4501 Grimes Place
- 4195 Alonzo Ave
- 4571 Gable Dr
- 4167 Alonzo Ave
- 17115 Rancho St
- 4634 White Oak Ave
- 17962 Valley Vista Blvd
- 4718 White Oak Ave
- 4841 Alonzo Ave
- 4854 Alonzo Ave
- 4860 Enfield Ave
- 18016 Valley Vista Blvd
- 18033 Rosita St
- 18310 Karen Dr
- 4700 Dunas Ln
- 4551 Lindley Ave
- 4620 Encino Ave
- 4072 Alonzo Ave
- 4501 Alonzo Ave
- 4455 Alonzo Ave
- 4512 White Oak Place
- 4511 Alonzo Ave
- 4524 White Oak Place
- 17786 Alonzo Place
- 4447 Alonzo Ave
- 4496 Coronet Dr
- 4495 Coronet Dr
- 4538 White Oak Place
- 4460 White Oak Place
- 17776 Alonzo Place
- 4521 Alonzo Ave
- 4515 White Oak Place
- 4430 White Oak Place
- 4436 Alonzo Ave
- 4475 White Oak Place
- 17785 Alonzo Place
- 4486 Coronet Dr
- 4535 White Oak Place