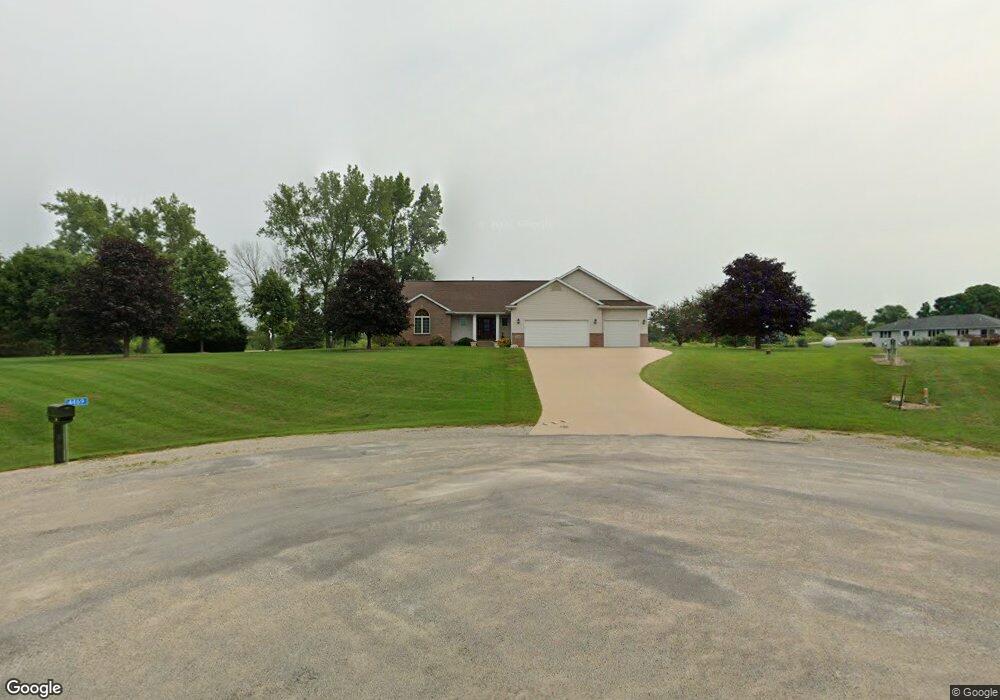
4469 Cedar Heights Cir Center Point, IA 52213
Estimated Value: $421,000 - $473,000
4
Beds
4
Baths
2,192
Sq Ft
$206/Sq Ft
Est. Value
About This Home
This home is located at 4469 Cedar Heights Cir, Center Point, IA 52213 and is currently estimated at $451,402, approximately $205 per square foot. 4469 Cedar Heights Cir is a home located in Linn County with nearby schools including Center Point-Urbana Primary School, Center Point-Urbana Intermediate School, and Center Point-Urbana Middle School.
Ownership History
Date
Name
Owned For
Owner Type
Purchase Details
Closed on
Aug 16, 2023
Sold by
Deklotz Brian A and Deklotz Rebecca S
Bought by
Deklotz Brian A and Deklotz Rebecca S
Current Estimated Value
Purchase Details
Closed on
Sep 27, 2001
Sold by
Labs Construction Inc
Bought by
Deklotz Brian A
Home Financials for this Owner
Home Financials are based on the most recent Mortgage that was taken out on this home.
Original Mortgage
$180,000
Interest Rate
6.97%
Mortgage Type
Purchase Money Mortgage
Purchase Details
Closed on
Nov 7, 2000
Sold by
Labs Donald H and Labs Doreen M
Bought by
Labs Construction Inc
Home Financials for this Owner
Home Financials are based on the most recent Mortgage that was taken out on this home.
Original Mortgage
$170,000
Interest Rate
7.87%
Mortgage Type
Construction
Create a Home Valuation Report for This Property
The Home Valuation Report is an in-depth analysis detailing your home's value as well as a comparison with similar homes in the area
Home Values in the Area
Average Home Value in this Area
Purchase History
| Date | Buyer | Sale Price | Title Company |
|---|---|---|---|
| Deklotz Brian A | -- | None Listed On Document | |
| Deklotz Brian A | $271,500 | -- | |
| Labs Construction Inc | $34,500 | -- |
Source: Public Records
Mortgage History
| Date | Status | Borrower | Loan Amount |
|---|---|---|---|
| Previous Owner | Deklotz Brian A | $180,000 | |
| Previous Owner | Labs Construction Inc | $170,000 |
Source: Public Records
Tax History Compared to Growth
Tax History
| Year | Tax Paid | Tax Assessment Tax Assessment Total Assessment is a certain percentage of the fair market value that is determined by local assessors to be the total taxable value of land and additions on the property. | Land | Improvement |
|---|---|---|---|---|
| 2025 | $5,742 | $476,500 | $66,300 | $410,200 |
| 2024 | $5,864 | $436,100 | $66,300 | $369,800 |
| 2023 | $5,864 | $436,100 | $66,300 | $369,800 |
| 2022 | $5,788 | $376,100 | $66,300 | $309,800 |
| 2021 | $5,406 | $376,100 | $66,300 | $309,800 |
| 2020 | $5,406 | $333,500 | $50,400 | $283,100 |
| 2019 | $5,062 | $311,800 | $50,400 | $261,400 |
| 2018 | $4,946 | $311,800 | $50,400 | $261,400 |
| 2017 | $4,932 | $301,200 | $50,400 | $250,800 |
| 2016 | $4,900 | $301,200 | $50,400 | $250,800 |
| 2015 | $4,869 | $301,200 | $50,400 | $250,800 |
| 2014 | $4,728 | $301,200 | $50,400 | $250,800 |
| 2013 | $4,606 | $301,200 | $50,400 | $250,800 |
Source: Public Records
Map
Nearby Homes
- 0 Indian Boundary Rd
- 4299 Lewis Access Rd
- 0 Palo Rd
- 4556 Cedar Ridge Rd
- 0 Grain Ln
- 829 Main St S
- 523 E Terrace Dr
- 318 Crestview Dr
- 529 Jefferson Ct
- 523 Rogers Ln
- 603 Pointer Cir
- 115 Main St
- 708 Rogers Ln
- 717 Pointer Cir
- 718 Pointer Cir
- 31 Acres N Center Point Rd
- 0 Iowa St
- 132 Green St
- 120 Green St
- 4505 Urbana Rd Unit West Parcel
- 4463 Cedar Heights Cir
- 4466 Cedar Heights Cir
- 4460 Cedar Heights Cir
- 4144 Cedar Heights Dr
- 4136 Cedar Heights Dr
- 4132 Cedar Heights Dr
- 4139 Cedar Heights Trail
- 4151 Cedar Heights Ln
- 4147 Cedar Heights Trail
- 4157 Cedar Heights Ln
- 4508 Bayou Ln
- 4131 Cedar Heights Trail
- 4141 Cedar Heights Dr
- 4145 Cedar Heights Ln
- 4120 Cedar Heights Dr
- 4133 Cedar Heights Dr
- 4512 Bayou Ln
- 4107 Cedar Heights Trail
- 4127 Cedar Heights Dr
- 4114 Cedar Heights Dr