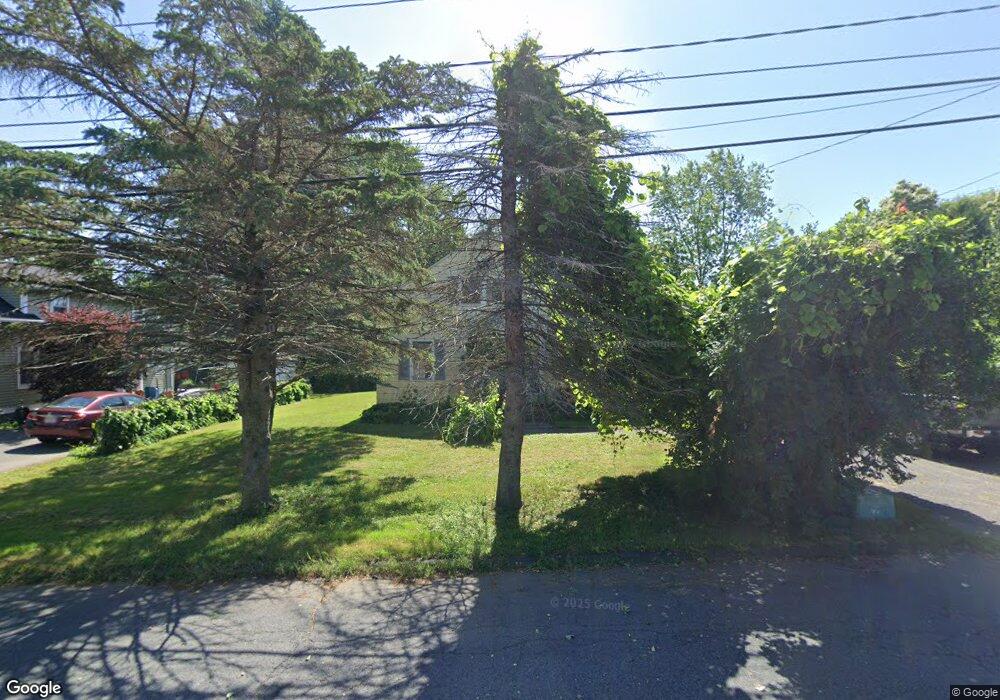
447 Davis St Greenfield, MA 01301
Estimated Value: $334,015 - $419,000
4
Beds
2
Baths
1,680
Sq Ft
$221/Sq Ft
Est. Value
About This Home
This home is located at 447 Davis St, Greenfield, MA 01301 and is currently estimated at $372,004, approximately $221 per square foot. 447 Davis St is a home located in Franklin County with nearby schools including Cornerstone Christian School, Holy Trinity School, and Stoneleigh-Burnham School.
Ownership History
Date
Name
Owned For
Owner Type
Purchase Details
Closed on
Aug 13, 1993
Sold by
Mcgrath Tammy L
Bought by
Pogoda Peter M
Current Estimated Value
Purchase Details
Closed on
Oct 12, 1990
Sold by
Potter Karl W
Bought by
Mcgrath Tommy L
Home Financials for this Owner
Home Financials are based on the most recent Mortgage that was taken out on this home.
Original Mortgage
$94,500
Interest Rate
10.18%
Mortgage Type
Purchase Money Mortgage
Create a Home Valuation Report for This Property
The Home Valuation Report is an in-depth analysis detailing your home's value as well as a comparison with similar homes in the area
Home Values in the Area
Average Home Value in this Area
Purchase History
We collect this data history from publicly available records. To have your information removed, we recommend requesting removal directly through your county’s website.
| Date | Buyer | Sale Price | Title Company |
|---|---|---|---|
| Pogoda Peter M | $2,500 | -- | |
| Pogoda Peter M | $2,500 | -- | |
| Mcgrath Tommy L | $105,000 | -- | |
| Mcgrath Tommy L | $105,000 | -- |
Source: Public Records
Mortgage History
We collect this data history from publicly available records. To have your information removed, we recommend requesting removal directly through your county’s website.
| Date | Status | Borrower | Loan Amount |
|---|---|---|---|
| Open | Mcgrath Tommy L | $84,000 | |
| Closed | Mcgrath Tommy L | $10,500 | |
| Previous Owner | Mcgrath Tommy L | $94,500 |
Source: Public Records
Tax History
| Year | Tax Paid | Tax Assessment Tax Assessment Total Assessment is a certain percentage of the fair market value that is determined by local assessors to be the total taxable value of land and additions on the property. | Land | Improvement |
|---|---|---|---|---|
| 2025 | $5,301 | $271,000 | $74,800 | $196,200 |
| 2024 | $5,208 | $255,400 | $61,600 | $193,800 |
| 2023 | $4,347 | $221,200 | $61,600 | $159,600 |
| 2022 | $4,245 | $190,200 | $58,700 | $131,500 |
| 2021 | $3,980 | $171,400 | $58,700 | $112,700 |
| 2020 | $3,834 | $167,200 | $58,700 | $108,500 |
| 2019 | $3,566 | $159,500 | $51,000 | $108,500 |
| 2018 | $3,506 | $156,300 | $49,900 | $106,400 |
| 2017 | $3,396 | $156,300 | $49,900 | $106,400 |
| 2016 | $3,535 | $162,100 | $52,800 | $109,300 |
| 2015 | $3,507 | $155,800 | $52,800 | $103,000 |
| 2014 | $3,205 | $156,100 | $52,800 | $103,300 |
Source: Public Records
Map
Nearby Homes
- 171 Cleveland St
- 306 Country Side Rd
- 37 Cleveland St
- 128 Silver St
- 346 Federal St
- 104 Silver St
- 24 Washburn Ave
- 264 Davis St
- 14 Garfield St Unit 16
- 14-16 Garfield St
- 85 School St
- 77 Conway St
- 59-61 Conway St
- 11 Conway St
- 20 Myers Farm Ln
- 52 Prospect St Unit A
- 7 I St
- 30 Mohawk Trail
- 21 Prospect Ave
- 97 Shelburne Rd
Your Personal Tour Guide
Ask me questions while you tour the home.