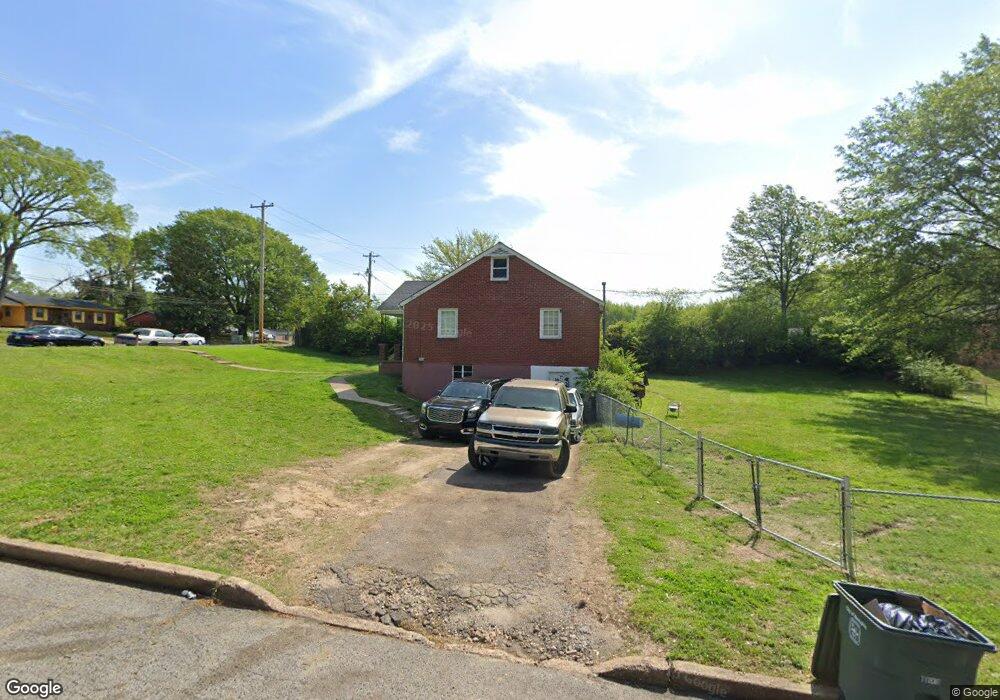
447 W Levi Rd Memphis, TN 38109
Westwood NeighborhoodEstimated Value: $80,145 - $113,000
3
Beds
1
Bath
1,204
Sq Ft
$76/Sq Ft
Est. Value
About This Home
This home is located at 447 W Levi Rd, Memphis, TN 38109 and is currently estimated at $91,286, approximately $75 per square foot. 447 W Levi Rd is a home located in Shelby County with nearby schools including Levi Elementary School, Chickasaw Middle School, and Westwood High School.
Ownership History
Date
Name
Owned For
Owner Type
Purchase Details
Closed on
Mar 30, 2021
Sold by
Hall L L L and Hall Lessie L
Bought by
Peppers Calvin
Current Estimated Value
Purchase Details
Closed on
May 6, 2009
Sold by
The Secretary Of Housing & Urban Develop
Bought by
Hall Lessie L
Purchase Details
Closed on
Dec 8, 2008
Sold by
White David
Bought by
The Secretary Of Housing & Urban Develop
Purchase Details
Closed on
Dec 15, 2000
Sold by
Lynch Terry A
Bought by
White David
Home Financials for this Owner
Home Financials are based on the most recent Mortgage that was taken out on this home.
Original Mortgage
$58,857
Interest Rate
7.65%
Mortgage Type
FHA
Purchase Details
Closed on
Aug 20, 1998
Sold by
Paige Millie Lou
Bought by
Lynch Terry A
Home Financials for this Owner
Home Financials are based on the most recent Mortgage that was taken out on this home.
Original Mortgage
$28,000
Interest Rate
6.91%
Create a Home Valuation Report for This Property
The Home Valuation Report is an in-depth analysis detailing your home's value as well as a comparison with similar homes in the area
Home Values in the Area
Average Home Value in this Area
Purchase History
| Date | Buyer | Sale Price | Title Company |
|---|---|---|---|
| Peppers Calvin | -- | None Available | |
| Hall Lessie L | $11,060 | None Available | |
| The Secretary Of Housing & Urban Develop | $70,572 | None Available | |
| White David | $59,000 | -- | |
| Lynch Terry A | $20,000 | -- |
Source: Public Records
Mortgage History
| Date | Status | Borrower | Loan Amount |
|---|---|---|---|
| Previous Owner | White David | $58,857 | |
| Previous Owner | Lynch Terry A | $28,000 | |
| Closed | White David | $3,582 |
Source: Public Records
Tax History Compared to Growth
Tax History
| Year | Tax Paid | Tax Assessment Tax Assessment Total Assessment is a certain percentage of the fair market value that is determined by local assessors to be the total taxable value of land and additions on the property. | Land | Improvement |
|---|---|---|---|---|
| 2025 | $441 | $16,625 | $2,900 | $13,725 |
| 2024 | $441 | $13,000 | $2,275 | $10,725 |
| 2023 | $792 | $13,000 | $2,275 | $10,725 |
| 2022 | $792 | $13,000 | $2,275 | $10,725 |
| 2021 | $359 | $13,000 | $2,275 | $10,725 |
| 2020 | $678 | $9,350 | $2,275 | $7,075 |
| 2019 | $299 | $9,350 | $2,275 | $7,075 |
| 2018 | $299 | $9,350 | $2,275 | $7,075 |
| 2017 | $306 | $9,350 | $2,275 | $7,075 |
| 2016 | $395 | $9,050 | $0 | $0 |
| 2014 | $395 | $9,050 | $0 | $0 |
Source: Public Records
Map
Nearby Homes
- 3807 Glenburee St
- 3953 Hedgerow Dr
- 3804 Glenburee St
- 3829 Ford Rd
- 529 Deerskin Dr
- 330 Granville Ave
- 3932 Dearborn St
- 4039 Trevathan Cir
- 547 W Raines Rd
- 4921 S Highway 61
- 4375 S Highway 61
- 3621 S 3rd St
- 0 S Third Unit 10199299
- 791 W Levi Rd
- 3571 Daggett Rd
- 4227 Arrow Rd
- 648 Pawnee Ave
- 0 Ford Rd
- 293 Carbon Rd
- 830 W Raines Rd