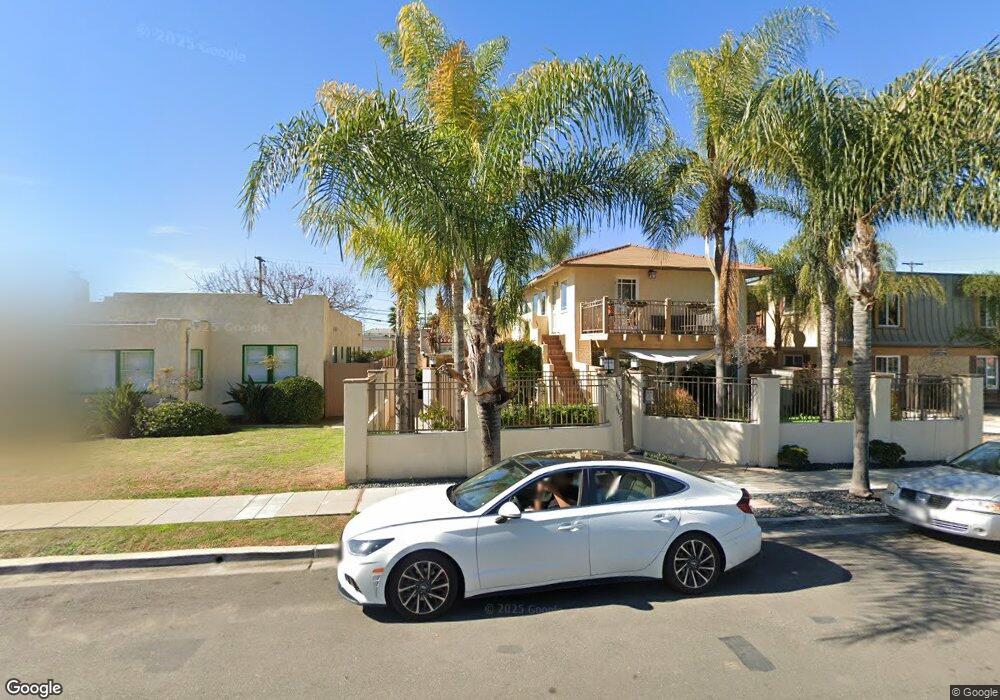
4470 39th St Unit B San Diego, CA 92116
Normal Heights NeighborhoodEstimated Value: $411,556 - $452,000
1
Bed
1
Bath
506
Sq Ft
$864/Sq Ft
Est. Value
About This Home
This home is located at 4470 39th St Unit B, San Diego, CA 92116 and is currently estimated at $437,139, approximately $863 per square foot. 4470 39th St Unit B is a home located in San Diego County with nearby schools including Normal Heights Elementary, Wilson Middle School, and Herbert Hoover High School.
Ownership History
Date
Name
Owned For
Owner Type
Purchase Details
Closed on
May 17, 2013
Sold by
California Housing Finance Agency
Bought by
Schnieders Laura
Current Estimated Value
Home Financials for this Owner
Home Financials are based on the most recent Mortgage that was taken out on this home.
Original Mortgage
$137,300
Outstanding Balance
$96,985
Interest Rate
3.41%
Mortgage Type
New Conventional
Estimated Equity
$340,154
Purchase Details
Closed on
Feb 20, 2013
Sold by
Reveles Susan
Bought by
The California Housing Finance Agency
Purchase Details
Closed on
Nov 29, 2005
Sold by
Normal Heights Village I Lp
Bought by
Reveles Susan
Home Financials for this Owner
Home Financials are based on the most recent Mortgage that was taken out on this home.
Original Mortgage
$15,000
Interest Rate
6.27%
Mortgage Type
Unknown
Create a Home Valuation Report for This Property
The Home Valuation Report is an in-depth analysis detailing your home's value as well as a comparison with similar homes in the area
Home Values in the Area
Average Home Value in this Area
Purchase History
| Date | Buyer | Sale Price | Title Company |
|---|---|---|---|
| Schnieders Laura | $192,500 | First American Title | |
| The California Housing Finance Agency | $250,210 | Orange Coast Title | |
| Reveles Susan | $251,000 | United Title Company |
Source: Public Records
Mortgage History
| Date | Status | Borrower | Loan Amount |
|---|---|---|---|
| Open | Schnieders Laura | $137,300 | |
| Previous Owner | Reveles Susan | $15,000 | |
| Previous Owner | Reveles Susan | $235,000 |
Source: Public Records
Tax History Compared to Growth
Tax History
| Year | Tax Paid | Tax Assessment Tax Assessment Total Assessment is a certain percentage of the fair market value that is determined by local assessors to be the total taxable value of land and additions on the property. | Land | Improvement |
|---|---|---|---|---|
| 2025 | $2,797 | $236,791 | $86,193 | $150,598 |
| 2024 | $2,797 | $232,149 | $84,503 | $147,646 |
| 2023 | $2,733 | $227,598 | $82,847 | $144,751 |
| 2022 | $2,659 | $223,136 | $81,223 | $141,913 |
| 2021 | $2,640 | $218,762 | $79,631 | $139,131 |
| 2020 | $2,607 | $216,520 | $78,815 | $137,705 |
| 2019 | $2,559 | $212,275 | $77,270 | $135,005 |
| 2018 | $2,392 | $208,113 | $75,755 | $132,358 |
| 2017 | $2,334 | $204,033 | $74,270 | $129,763 |
| 2016 | $2,295 | $200,033 | $72,814 | $127,219 |
| 2015 | $2,260 | $197,030 | $71,721 | $125,309 |
| 2014 | $2,224 | $193,172 | $70,317 | $122,855 |
Source: Public Records
Map
Nearby Homes
- 4411 Mcclintock St
- 4342 39th St
- 3909 Monroe Ave Unit 101
- 3848 Monroe Ave
- 4542 Cherokee Ave
- 4233 39th St Unit C
- 4555-57 36th St
- 4358-64 36th St
- 4609 E Mountain View Dr
- 3737 Orange Ave
- 4146-50 Monroe Ave
- 4554 Marlborough Dr Unit 1
- 4164 38th St
- 3535 Monroe Ave Unit 51
- 3535 Monroe Ave Unit 5
- 4332 Wilson Ave
- 4164 Cherokee Ave Unit G
- 4119 Orange Ave
- 4174 Marlborough Ave Unit 8
- 4102 Cherokee Ave
- 4472 39th St
- 4472 39th St Unit B
- 4472 39th St Unit A
- 4470 39th St Unit A
- 4468 39th St Unit U4
- 4462 39th St
- 4476 39th St
- 4486 39th St
- 4452 39th St Unit 54
- 4452 39th St
- 4465 38th St Unit 67
- 4469 38th St
- 4473 38th St
- 4444 39th St
- 4494 39th St
- 3827 Monroe Ave
- 4455 38th St
- 3819 Monroe Ave
- 4467 39th St
- 4475 39th St