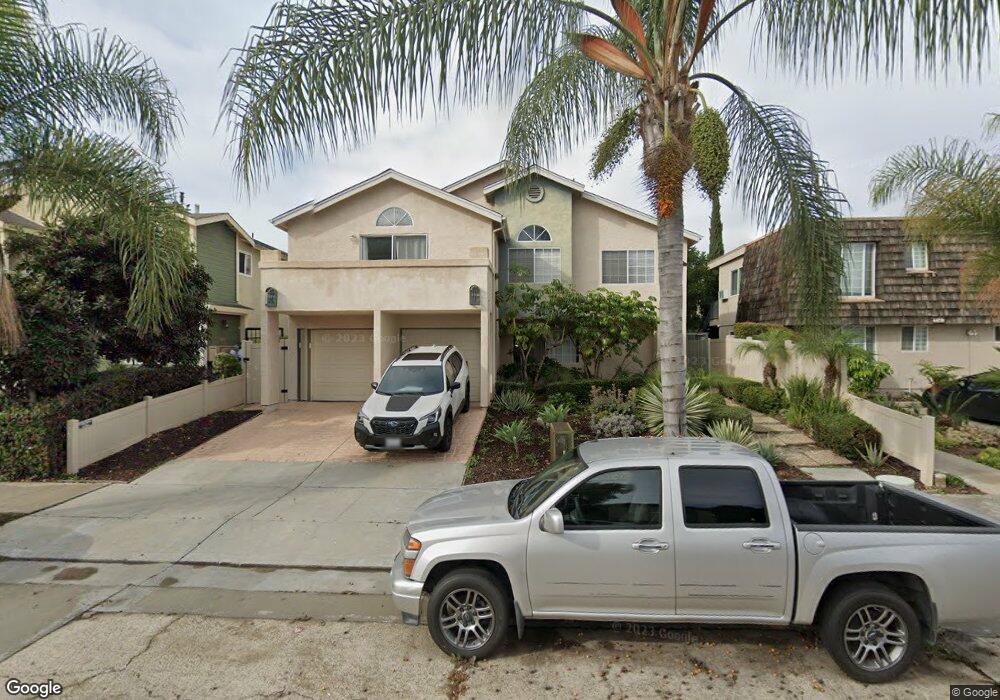
4470 48th St Unit 6 San Diego, CA 92115
Talmadge NeighborhoodEstimated Value: $492,000 - $614,000
2
Beds
2
Baths
838
Sq Ft
$635/Sq Ft
Est. Value
About This Home
This home is located at 4470 48th St Unit 6, San Diego, CA 92115 and is currently estimated at $532,075, approximately $634 per square foot. 4470 48th St Unit 6 is a home located in San Diego County with nearby schools including Fay Elementary School, Mann Middle School, and Crawford High School.
Ownership History
Date
Name
Owned For
Owner Type
Purchase Details
Closed on
Nov 11, 2020
Sold by
Hardy Patricia Jean and The Patti Hardy Living Trust
Bought by
Borbon Keithmichael and Borbon Ida
Current Estimated Value
Home Financials for this Owner
Home Financials are based on the most recent Mortgage that was taken out on this home.
Original Mortgage
$358,484
Outstanding Balance
$318,422
Interest Rate
2.7%
Mortgage Type
VA
Estimated Equity
$213,653
Purchase Details
Closed on
Sep 17, 2015
Sold by
Hardy Patricia Jean
Bought by
Hardy Patricia Jean
Purchase Details
Closed on
Apr 21, 2015
Sold by
Lambert Jack A and Lambert Alice E
Bought by
Hardy Patricia Jean
Purchase Details
Closed on
Aug 27, 2014
Sold by
Lambert Jack A
Bought by
Lambert Jack A and Lambert Alice E
Purchase Details
Closed on
Oct 8, 2013
Sold by
Lambert Jack A and Lambert Alice E
Bought by
Lambert Jack A
Purchase Details
Closed on
Mar 26, 2008
Sold by
4470 48Th Street Llc
Bought by
Lambert Jack A and Lambert Alice E
Create a Home Valuation Report for This Property
The Home Valuation Report is an in-depth analysis detailing your home's value as well as a comparison with similar homes in the area
Home Values in the Area
Average Home Value in this Area
Purchase History
| Date | Buyer | Sale Price | Title Company |
|---|---|---|---|
| Borbon Keithmichael | $350,500 | Ticor Title Sd Commercial | |
| Hardy Patricia Jean | -- | None Available | |
| Hardy Patricia Jean | $230,000 | First American Title Company | |
| Lambert Jack A | -- | Accommodation | |
| Lambert Jack A | -- | None Available | |
| Lambert Jack A | -- | Accommodation |
Source: Public Records
Mortgage History
| Date | Status | Borrower | Loan Amount |
|---|---|---|---|
| Open | Borbon Keithmichael | $358,484 |
Source: Public Records
Tax History Compared to Growth
Tax History
| Year | Tax Paid | Tax Assessment Tax Assessment Total Assessment is a certain percentage of the fair market value that is determined by local assessors to be the total taxable value of land and additions on the property. | Land | Improvement |
|---|---|---|---|---|
| 2025 | $4,520 | $379,307 | $158,350 | $220,957 |
| 2024 | $4,520 | $371,871 | $155,246 | $216,625 |
| 2023 | $4,419 | $364,580 | $152,202 | $212,378 |
| 2022 | $4,300 | $357,432 | $149,218 | $208,214 |
| 2021 | $4,356 | $350,425 | $146,293 | $204,132 |
| 2020 | $3,146 | $252,750 | $105,516 | $147,234 |
| 2019 | $3,091 | $247,796 | $103,448 | $144,348 |
| 2018 | $2,891 | $242,938 | $101,420 | $141,518 |
| 2017 | $2,823 | $238,176 | $99,432 | $138,744 |
| 2016 | $2,777 | $233,507 | $97,483 | $136,024 |
| 2015 | $2,328 | $195,190 | $81,487 | $113,703 |
| 2014 | $2,292 | $191,367 | $79,891 | $111,476 |
Source: Public Records
Map
Nearby Homes
- 4482 48th St
- 4481 Estrella Ave Unit 1-10
- 4482 47th St
- 4904 El Cajon Blvd Unit 1
- 4455 Winona Ave
- 5018 Monroe Ave
- 4550 Norma Dr
- 4921 Trojan Ave Unit 3
- 4921 Trojan Ave Unit 2
- 5028 Monroe Ave
- 4230 48th St Unit 2
- 4230 48th St Unit 9
- 4230 48th St Unit 5
- 4734 Miracle Dr
- 4235 49th St
- 4472-74 51st St
- 4437 51st St Unit 3
- 4222 Menlo Ave Unit 17
- 4244 46th St
- 4730 Winona Ave
- 4470 48th St
- 4470 48th St Unit 5
- 4470 48th St Unit 4
- 4470 48th St Unit 3
- 4470 48th St Unit 2
- 4466 48th St 4466 48th St Unit 3
- 4466 48th St Unit 7
- 4466 48th St Unit 6
- 4466 48th St Unit 5
- 4466 48th St Unit 4
- 4466 48th St Unit 1
- 4466 48th 4466 48th St Unit 3
- 4478 48th St
- 4458 48th St Unit 60
- 4465 Euclid Ave
- 4465-69 Euclid Ave
- 4471 Euclid Ave Unit 73
- 4465 - 446 Euclid Ave
- 4450 48th St Unit 56
- 4463 48th St