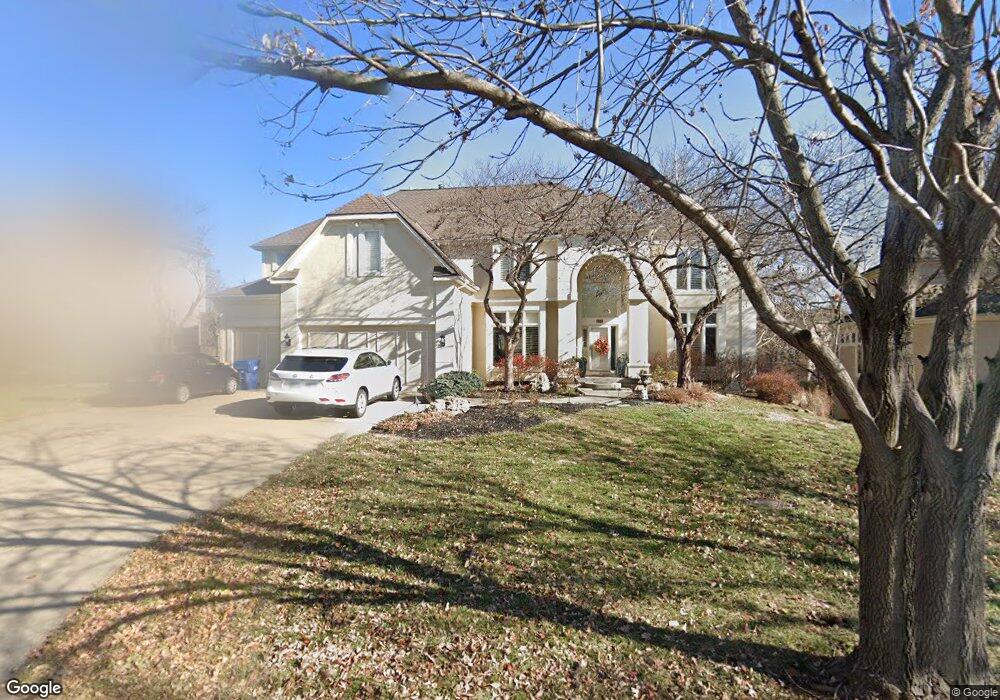
4470 W 150th Terrace Overland Park, KS 66224
Estimated Value: $829,000 - $920,000
4
Beds
6
Baths
4,557
Sq Ft
$196/Sq Ft
Est. Value
About This Home
This home is located at 4470 W 150th Terrace, Overland Park, KS 66224 and is currently estimated at $891,338, approximately $195 per square foot. 4470 W 150th Terrace is a home located in Johnson County with nearby schools including Prairie Star Elementary School, Prairie Star Middle School, and Blue Valley High School.
Ownership History
Date
Name
Owned For
Owner Type
Purchase Details
Closed on
Jul 26, 2012
Sold by
Dunham Darrell R
Bought by
Chapuk Sahar A
Current Estimated Value
Home Financials for this Owner
Home Financials are based on the most recent Mortgage that was taken out on this home.
Original Mortgage
$397,500
Outstanding Balance
$261,413
Interest Rate
2.62%
Mortgage Type
New Conventional
Estimated Equity
$629,925
Purchase Details
Closed on
Jul 6, 2004
Sold by
Hill Patricia A
Bought by
Dunham Darrell R
Home Financials for this Owner
Home Financials are based on the most recent Mortgage that was taken out on this home.
Original Mortgage
$552,000
Interest Rate
6.26%
Mortgage Type
Purchase Money Mortgage
Purchase Details
Closed on
May 18, 2001
Sold by
Fred Riley Home Building Corp
Bought by
Hill Patricia A and The Patricia A Hill Revocable Trust
Create a Home Valuation Report for This Property
The Home Valuation Report is an in-depth analysis detailing your home's value as well as a comparison with similar homes in the area
Home Values in the Area
Average Home Value in this Area
Purchase History
| Date | Buyer | Sale Price | Title Company |
|---|---|---|---|
| Chapuk Sahar A | -- | Stewart Title Company Midwes | |
| Dunham Darrell R | -- | Security Land Title Company | |
| Hill Patricia A | -- | Security Land Title Company |
Source: Public Records
Mortgage History
| Date | Status | Borrower | Loan Amount |
|---|---|---|---|
| Open | Chapuk Sahar A | $397,500 | |
| Previous Owner | Dunham Darrell R | $552,000 | |
| Closed | Dunham Darrell R | $50,000 |
Source: Public Records
Tax History Compared to Growth
Tax History
| Year | Tax Paid | Tax Assessment Tax Assessment Total Assessment is a certain percentage of the fair market value that is determined by local assessors to be the total taxable value of land and additions on the property. | Land | Improvement |
|---|---|---|---|---|
| 2024 | $10,620 | $94,909 | $16,969 | $77,940 |
| 2023 | $10,194 | $90,102 | $16,969 | $73,133 |
| 2022 | $10,430 | $90,194 | $16,969 | $73,225 |
| 2021 | $10,054 | $83,168 | $16,969 | $66,199 |
| 2020 | $9,492 | $76,958 | $15,420 | $61,538 |
| 2019 | $9,043 | $72,024 | $13,402 | $58,622 |
| 2018 | $8,282 | $65,987 | $11,655 | $54,332 |
| 2017 | $8,289 | $63,779 | $11,655 | $52,124 |
| 2016 | $8,006 | $61,675 | $12,664 | $49,011 |
| 2015 | $8,131 | $61,870 | $12,664 | $49,206 |
| 2013 | -- | $57,213 | $12,664 | $44,549 |
Source: Public Records
Map
Nearby Homes
- 4466 W 150th Terrace
- 4421 W 150th St
- 14810 Sherwood St
- 13606 Granada St
- 13608 Granada St
- 14708 Cedar St
- 5108 W 150th St
- 4704 W 152nd St
- 15164 Sherwood St
- 5264 W 150th Terrace
- 15201 Catalina
- 15206 Catalina
- 14913 Ash St
- 14706 Mohawk Cir
- 3609 Iron Horse Ct
- 14713 Ash St
- 3509 W 150th St
- 15145 Mohawk Cir
- 14919 Reinhardt St
- 0 Mission Rd Unit HMS2528409
- 4474 W 150th Terrace
- 14822 Granada Ct
- 4462 W 150th Terrace
- 4469 W 150th Terrace
- 4478 W 150th Terrace
- 4465 W 150th Terrace
- 4417 W 150th St
- 14819 Granada Ct
- 4424 W 150th St
- 4461 W 150th Terrace
- 4458 W 150th Terrace
- 4482 W 150th Terrace
- 14818 Granada Ct
- 4473 W 150th Terrace
- 15045 Sherwood St
- 4413 W 150th St
- 15045 Sherwood Rd
- 15041 Sherwood Rd
- 15041 Sherwood St
- 14817 Sherwood St