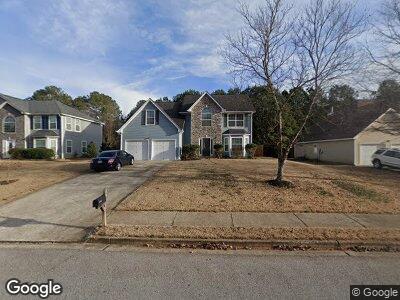
4471 Glider Cir Douglasville, GA 30135
Anneewakee NeighborhoodEstimated Value: $336,000 - $376,000
4
Beds
3
Baths
2,827
Sq Ft
$124/Sq Ft
Est. Value
About This Home
This home is located at 4471 Glider Cir, Douglasville, GA 30135 and is currently estimated at $351,254, approximately $124 per square foot. 4471 Glider Cir is a home located in Douglas County with nearby schools including Holly Springs Elementary School, Chapel Hill Middle School, and New Manchester High School.
Ownership History
Date
Name
Owned For
Owner Type
Purchase Details
Closed on
Jun 6, 2011
Sold by
Hud-Housing Of Urban Dev
Bought by
Newsome John
Current Estimated Value
Home Financials for this Owner
Home Financials are based on the most recent Mortgage that was taken out on this home.
Original Mortgage
$87,718
Interest Rate
4.75%
Mortgage Type
FHA
Purchase Details
Closed on
Sep 7, 2010
Sold by
Citimortgage
Bought by
Hud-Housing Of Urban Dev
Purchase Details
Closed on
Sep 1, 2010
Sold by
Law Safini R
Bought by
Citimortgage
Purchase Details
Closed on
Aug 31, 2004
Sold by
Legacy Communities Of Natures
Bought by
Law Safini R
Home Financials for this Owner
Home Financials are based on the most recent Mortgage that was taken out on this home.
Original Mortgage
$131,100
Interest Rate
4.75%
Mortgage Type
New Conventional
Create a Home Valuation Report for This Property
The Home Valuation Report is an in-depth analysis detailing your home's value as well as a comparison with similar homes in the area
Home Values in the Area
Average Home Value in this Area
Purchase History
| Date | Buyer | Sale Price | Title Company |
|---|---|---|---|
| Newsome John | -- | -- | |
| Hud-Housing Of Urban Dev | -- | -- | |
| Citimortgage | $185,880 | -- | |
| Law Safini R | $163,900 | -- |
Source: Public Records
Mortgage History
| Date | Status | Borrower | Loan Amount |
|---|---|---|---|
| Closed | Newsome John H | $5,161 | |
| Open | Newsome John H | $76,319 | |
| Closed | Newsome John | $87,718 | |
| Previous Owner | Law Safini R | $181,482 | |
| Previous Owner | Law Safini R | $148,000 | |
| Previous Owner | Law Safini R | $18,500 | |
| Previous Owner | Law Safini R | $131,100 |
Source: Public Records
Tax History Compared to Growth
Tax History
| Year | Tax Paid | Tax Assessment Tax Assessment Total Assessment is a certain percentage of the fair market value that is determined by local assessors to be the total taxable value of land and additions on the property. | Land | Improvement |
|---|---|---|---|---|
| 2024 | $3,124 | $134,440 | $25,920 | $108,520 |
| 2023 | $3,124 | $134,440 | $25,920 | $108,520 |
| 2022 | $2,589 | $102,720 | $18,000 | $84,720 |
| 2021 | $2,384 | $92,240 | $18,160 | $74,080 |
| 2020 | $2,175 | $80,080 | $10,440 | $69,640 |
| 2019 | $1,951 | $75,520 | $10,440 | $65,080 |
| 2018 | $1,922 | $73,600 | $10,440 | $63,160 |
| 2017 | $1,803 | $66,800 | $10,560 | $56,240 |
| 2016 | $1,662 | $59,080 | $9,760 | $49,320 |
| 2015 | $1,254 | $49,880 | $8,560 | $41,320 |
| 2014 | $1,254 | $39,000 | $7,120 | $31,880 |
| 2013 | -- | $32,760 | $6,040 | $26,720 |
Source: Public Records
Map
Nearby Homes
- 4506 White Rd
- 4524 Glider Cir
- 3694 Arrowhead Place
- 4419 White Rd
- 4542 White Rd
- 3577 N Winds Trail
- 4880 Bald Eagle Way
- 3203 Lower Creek Dr
- 3448 Craggy Perch Unit 4
- 3681 Auger Trail
- 4438 Tuckahoe Ct
- 4615 Thermal Ct
- 4625 Thermal Ct Unit 1
- 4015 Soaring Dr
- 4030 Staghorn Ct
- 3530 Ridge Hill Pkwy
- 3475 Ridge Hill Pkwy
- 3290 Forest Green Dr
- 4471 Glider Cir
- 4461 Glider Cir
- 4481 Glider Cir Unit 4
- 4491 Glider Cir
- 4451 Glider Cir
- 3639 Craggy Perch
- 4484 Glider Cir Unit 4
- 4464 Glider Cir
- 4464 Glider Cir Unit 142
- 3609 Craggy Perch Unit 4
- 3599 Craggy Perch
- 4501 Glider Cir Unit 4
- 4501 Glider Cir Unit 4501
- 4501 Glider Cir
- 3619 Craggy Perch Unit 4
- 3649 Craggy Perch
- 3589 Craggy Perch Unit 1
- 4474 Glider Cir Unit 4
- 4441 Glider Cir
- 4494 Glider Cir Unit 4