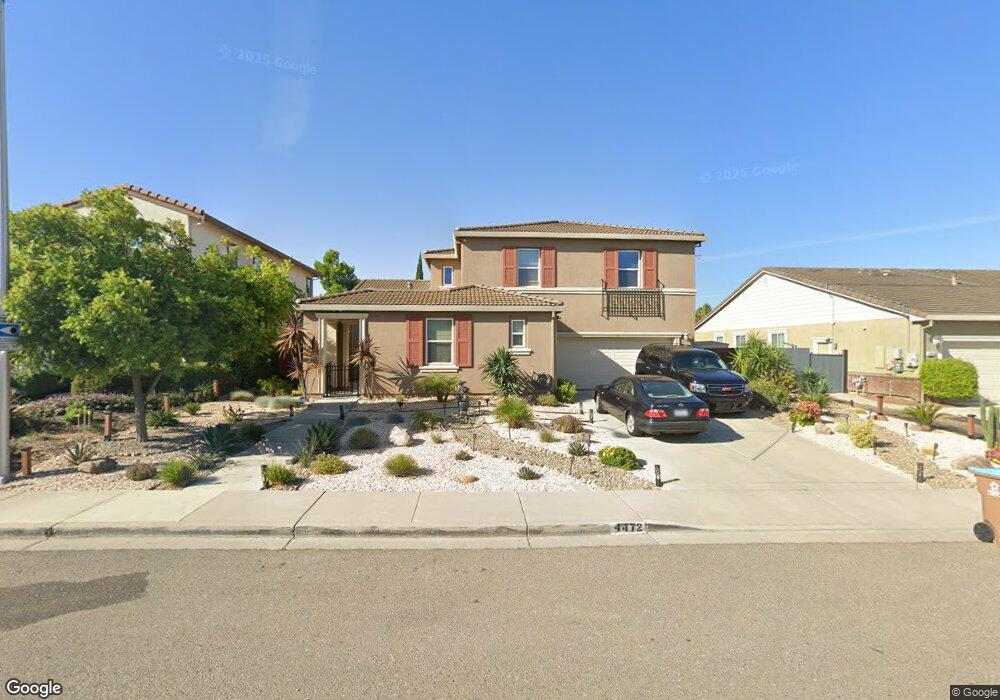
4472 Le Conte Cir Antioch, CA 94531
Country Hills NeighborhoodEstimated Value: $761,000 - $800,000
5
Beds
4
Baths
2,877
Sq Ft
$274/Sq Ft
Est. Value
About This Home
This home is located at 4472 Le Conte Cir, Antioch, CA 94531 and is currently estimated at $788,670, approximately $274 per square foot. 4472 Le Conte Cir is a home located in Contra Costa County with nearby schools including Grant Elementary School, Black Diamond Middle School, and Deer Valley High School.
Ownership History
Date
Name
Owned For
Owner Type
Purchase Details
Closed on
Sep 24, 2021
Sold by
Stewart Alashia J
Bought by
Stewart Alashia J and Stewart Kalen D
Current Estimated Value
Home Financials for this Owner
Home Financials are based on the most recent Mortgage that was taken out on this home.
Original Mortgage
$350,000
Outstanding Balance
$318,474
Interest Rate
2.8%
Mortgage Type
New Conventional
Estimated Equity
$470,196
Purchase Details
Closed on
Dec 1, 2017
Sold by
Dunn Deandrea and Stewart Alashia
Bought by
Stewart Alashia J
Purchase Details
Closed on
Jun 28, 2011
Sold by
Lb L Duc Iii Antioch 330 Llc
Bought by
Dunn Deandrea and Stewart Alashia
Home Financials for this Owner
Home Financials are based on the most recent Mortgage that was taken out on this home.
Original Mortgage
$299,623
Interest Rate
4.53%
Mortgage Type
FHA
Create a Home Valuation Report for This Property
The Home Valuation Report is an in-depth analysis detailing your home's value as well as a comparison with similar homes in the area
Home Values in the Area
Average Home Value in this Area
Purchase History
| Date | Buyer | Sale Price | Title Company |
|---|---|---|---|
| Stewart Alashia J | -- | American Coast Title | |
| Stewart Alashia J | -- | First American Title | |
| Dunn Deandrea | $349,500 | First American Title Company |
Source: Public Records
Mortgage History
| Date | Status | Borrower | Loan Amount |
|---|---|---|---|
| Open | Stewart Alashia J | $350,000 | |
| Previous Owner | Dunn Deandrea | $299,623 |
Source: Public Records
Tax History Compared to Growth
Tax History
| Year | Tax Paid | Tax Assessment Tax Assessment Total Assessment is a certain percentage of the fair market value that is determined by local assessors to be the total taxable value of land and additions on the property. | Land | Improvement |
|---|---|---|---|---|
| 2025 | $7,249 | $577,811 | $102,512 | $475,299 |
| 2024 | $6,916 | $566,482 | $100,502 | $465,980 |
| 2023 | $6,916 | $555,376 | $98,532 | $456,844 |
| 2022 | $6,809 | $544,487 | $96,600 | $447,887 |
| 2021 | $6,473 | $533,811 | $94,706 | $439,105 |
| 2019 | $6,417 | $517,980 | $91,898 | $426,082 |
| 2018 | $6,199 | $507,825 | $90,097 | $417,728 |
| 2017 | $5,001 | $402,598 | $54,111 | $348,487 |
| 2016 | $4,901 | $394,704 | $53,050 | $341,654 |
| 2015 | $5,209 | $388,777 | $52,254 | $336,523 |
| 2014 | $6,224 | $381,162 | $51,231 | $329,931 |
Source: Public Records
Map
Nearby Homes
- 4517 Goode St
- 4560 Benton St
- 4137 Amargosa Dr
- 51 Cunha Ct
- 4316 Berryessa Ct
- 3911 Folsom Dr
- 736 Temescal Ct
- 2835 Bluebell Cir
- 4586 Donegal Way
- 4747 Dundee St
- 2901 Larkspur Dr
- 2819 Larkspur Dr
- 2912 Honeynut St
- Plan 2029 at Laurel Ranch - Bayberry
- Plan 2045 Modeled at Laurel Ranch - Bayberry
- 3238 Panda Ct
- 5413 Riverview Ln
- 3124 Sunflower Dr
- 5420 Riverview Ln
- 2725 Harvest Ln
- 4476 Le Conte Cir
- 4468 Le Conte Cir
- 4468 Le Conte Cl
- 4473 Spire St
- 4477 Spire St
- 4469 Spire St
- 4480 Le Conte Cir
- 4481 Spire St
- 4475 Le Conte Cir
- 4471 Le Conte Cir
- 4465 Spire St
- 4479 Le Conte Cir
- 4467 Le Conte Cir
- 4484 Le Conte Cir
- 4485 Spire St
- 4446 Spire St
- 4483 Le Conte Cir
- 4450 Spire St
- 4438 Spire St