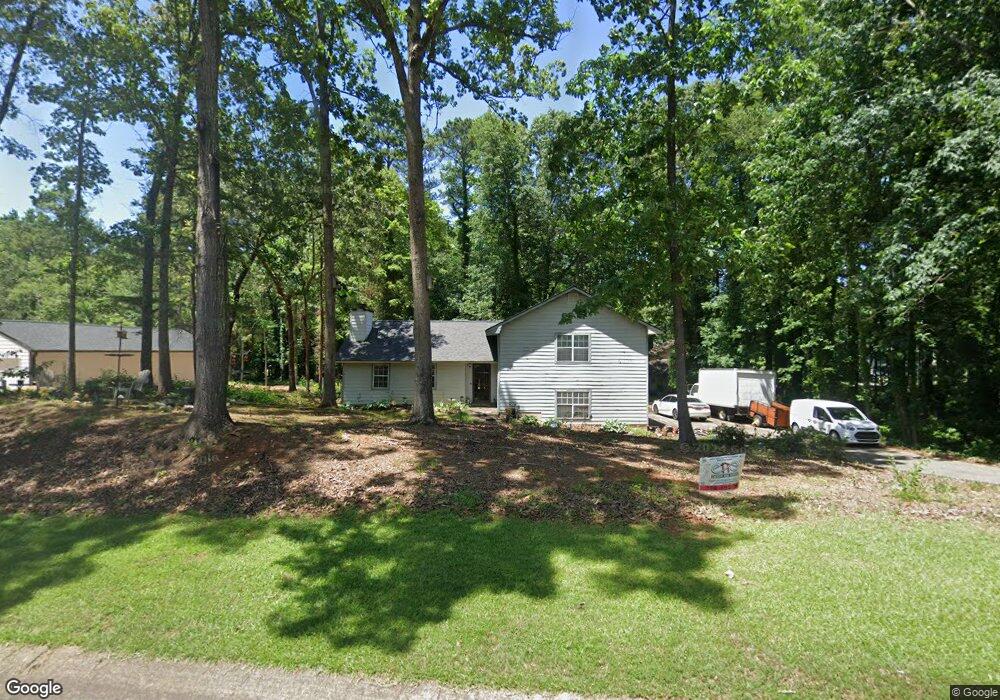
4475 S Landing Dr Unit 5 Marietta, GA 30066
Sandy Plains NeighborhoodEstimated Value: $359,753 - $404,000
3
Beds
2
Baths
1,432
Sq Ft
$268/Sq Ft
Est. Value
About This Home
This home is located at 4475 S Landing Dr Unit 5, Marietta, GA 30066 and is currently estimated at $384,188, approximately $268 per square foot. 4475 S Landing Dr Unit 5 is a home located in Cobb County with nearby schools including Keheley Elementary School and McCleskey Middle School.
Ownership History
Date
Name
Owned For
Owner Type
Purchase Details
Closed on
Mar 29, 2010
Sold by
Thrift Cary G and Thrift Karen
Bought by
Thrift Cary G and Thrift Karen K
Current Estimated Value
Home Financials for this Owner
Home Financials are based on the most recent Mortgage that was taken out on this home.
Original Mortgage
$95,000
Outstanding Balance
$62,743
Interest Rate
4.91%
Mortgage Type
New Conventional
Estimated Equity
$321,445
Purchase Details
Closed on
Jul 28, 2009
Sold by
Thrift Cary G
Bought by
Thrift Cary G and Thrift Karen
Purchase Details
Closed on
Jul 7, 1993
Sold by
Nuttall John Marsha K
Bought by
Thrift Cary G
Home Financials for this Owner
Home Financials are based on the most recent Mortgage that was taken out on this home.
Original Mortgage
$95,073
Interest Rate
7.5%
Mortgage Type
VA
Create a Home Valuation Report for This Property
The Home Valuation Report is an in-depth analysis detailing your home's value as well as a comparison with similar homes in the area
Home Values in the Area
Average Home Value in this Area
Purchase History
| Date | Buyer | Sale Price | Title Company |
|---|---|---|---|
| Thrift Cary G | -- | -- | |
| Thrift Cary G | -- | -- | |
| Thrift Cary G | $93,900 | -- |
Source: Public Records
Mortgage History
| Date | Status | Borrower | Loan Amount |
|---|---|---|---|
| Open | Thrift Cary G | $95,000 | |
| Previous Owner | Thrift Cary G | $95,073 |
Source: Public Records
Tax History Compared to Growth
Tax History
| Year | Tax Paid | Tax Assessment Tax Assessment Total Assessment is a certain percentage of the fair market value that is determined by local assessors to be the total taxable value of land and additions on the property. | Land | Improvement |
|---|---|---|---|---|
| 2025 | $697 | $135,812 | $36,000 | $99,812 |
| 2024 | $700 | $135,812 | $36,000 | $99,812 |
| 2023 | $483 | $132,092 | $36,000 | $96,092 |
| 2022 | $595 | $100,600 | $26,000 | $74,600 |
| 2021 | $531 | $79,384 | $24,000 | $55,384 |
| 2020 | $531 | $79,384 | $24,000 | $55,384 |
| 2019 | $526 | $77,596 | $18,400 | $59,196 |
| 2018 | $501 | $69,456 | $18,400 | $51,056 |
| 2017 | $443 | $67,256 | $18,400 | $48,856 |
| 2016 | $1,243 | $54,360 | $17,200 | $37,160 |
| 2015 | $1,087 | $46,068 | $12,000 | $34,068 |
| 2014 | $1,096 | $46,068 | $0 | $0 |
Source: Public Records
Map
Nearby Homes
- 4509 N Landing Dr
- 4509 N Bay Ct
- 4314 Keheley Lake Ct NE
- 4281 Keheley Lake Dr NE
- 4499 Browning Ct NE
- 1765 Blackwillow Dr
- 4181 Keheley Dr NE
- 4056 Longford Dr NE
- 1740 Latour Dr NE
- 4592 N Landing Dr
- 1849 Service Dr NE
- 2603 Chadwick Rd
- 4709 Trickum Rd NE
- 1718 Christie Dr NE
- 4797 North Trail
- 2610 Chadwick Rd
- 4463 S Landing Dr
- 4367 S Landing Trail
- 4353 S Landing Trail
- 4451 S Landing Dr Unit 5
- 4474 S Landing Dr Unit 5
- 4484 S Landing Dr
- 4464 S Landing Dr Unit 5
- 4454 S Landing Dr Unit 5
- 2034 S Cove Trail Unit 6
- 4375 S Landing Trail
- 4435 S Landing Dr Unit 5
- 4494 S Landing Dr
- 2020 S Cove Trail
- 4374 S Landing Trail
- 4444 S Landing Dr Unit 4444
- 4444 S Landing Dr
- 2044 S Cove Trail Unit 6
- 4504 S Landing Dr
- 4423 S Landing Dr Unit 5
- 1683 Hollander Ct