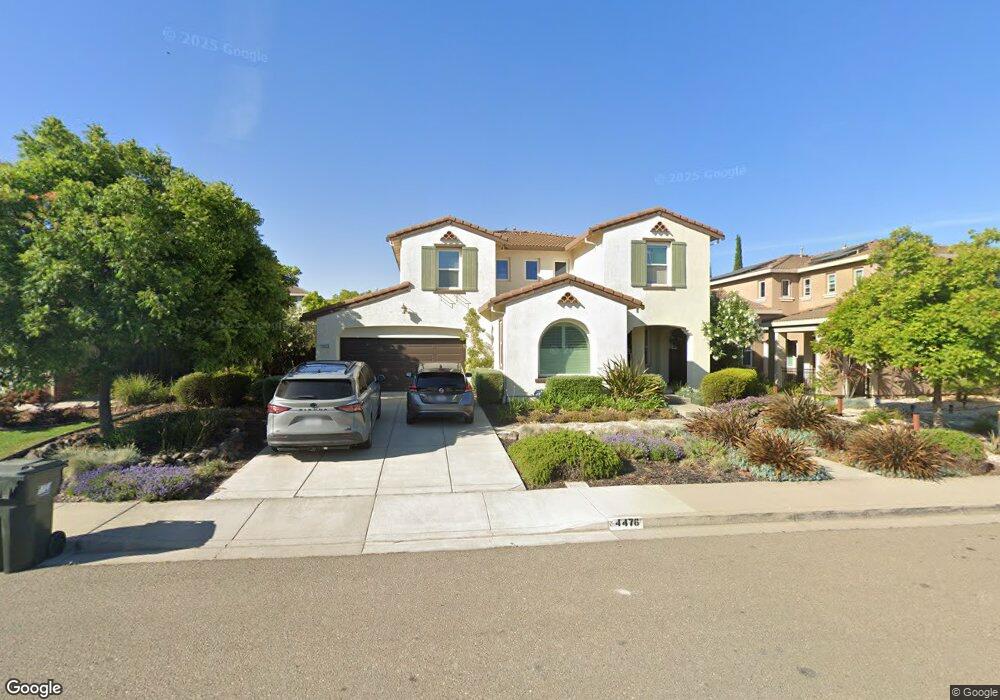
4476 Le Conte Cir Antioch, CA 94531
Country Hills NeighborhoodEstimated Value: $748,000 - $776,000
5
Beds
4
Baths
2,910
Sq Ft
$262/Sq Ft
Est. Value
About This Home
This home is located at 4476 Le Conte Cir, Antioch, CA 94531 and is currently estimated at $763,022, approximately $262 per square foot. 4476 Le Conte Cir is a home located in Contra Costa County with nearby schools including Grant Elementary School, Black Diamond Middle School, and Deer Valley High School.
Ownership History
Date
Name
Owned For
Owner Type
Purchase Details
Closed on
Jun 13, 2014
Sold by
Olavides Michael C and Olavides Sarah V
Bought by
Olavides Living Trust
Current Estimated Value
Home Financials for this Owner
Home Financials are based on the most recent Mortgage that was taken out on this home.
Original Mortgage
$313,200
Outstanding Balance
$168,598
Interest Rate
4.09%
Mortgage Type
New Conventional
Estimated Equity
$594,424
Purchase Details
Closed on
Sep 22, 2012
Sold by
Olavides Michael and Olavides Sarah
Bought by
Olavides Michael C and Olavides Sarah
Purchase Details
Closed on
Oct 29, 2010
Sold by
Lb L Duc Iii Antioch 330 Llc
Bought by
Olavides Michael and Olavides Sarah
Home Financials for this Owner
Home Financials are based on the most recent Mortgage that was taken out on this home.
Original Mortgage
$328,529
Interest Rate
4.23%
Mortgage Type
FHA
Create a Home Valuation Report for This Property
The Home Valuation Report is an in-depth analysis detailing your home's value as well as a comparison with similar homes in the area
Home Values in the Area
Average Home Value in this Area
Purchase History
| Date | Buyer | Sale Price | Title Company |
|---|---|---|---|
| Olavides Living Trust | -- | Placer Title Company | |
| Olavides Michael C | -- | Placer Title Company | |
| Olavides Michael C | -- | None Available | |
| Olavides Michael | $333,000 | First American Title Company |
Source: Public Records
Mortgage History
| Date | Status | Borrower | Loan Amount |
|---|---|---|---|
| Open | Olavides Michael C | $313,200 | |
| Closed | Olavides Michael | $328,529 |
Source: Public Records
Tax History Compared to Growth
Tax History
| Year | Tax Paid | Tax Assessment Tax Assessment Total Assessment is a certain percentage of the fair market value that is determined by local assessors to be the total taxable value of land and additions on the property. | Land | Improvement |
|---|---|---|---|---|
| 2025 | $5,352 | $426,618 | $42,272 | $384,346 |
| 2024 | $5,218 | $418,254 | $41,444 | $376,810 |
| 2023 | $5,218 | $410,054 | $40,632 | $369,422 |
| 2022 | $5,139 | $402,015 | $39,836 | $362,179 |
| 2021 | $4,944 | $394,133 | $39,055 | $355,078 |
| 2019 | $4,892 | $382,446 | $37,898 | $344,548 |
| 2018 | $4,727 | $374,948 | $37,155 | $337,793 |
| 2017 | $4,614 | $367,597 | $36,427 | $331,170 |
| 2016 | $4,520 | $360,390 | $35,713 | $324,677 |
| 2015 | $4,829 | $354,978 | $35,177 | $319,801 |
| 2014 | $5,854 | $348,025 | $34,488 | $313,537 |
Source: Public Records
Map
Nearby Homes
- 4491 Le Conte Cir
- 4535 Bitter St
- 4528 Benton St
- 4545 Half Dome St
- 4576 Benton St
- 4137 Amargosa Dr
- 4426 Palisades Way
- 4316 Berryessa Ct
- 736 Temescal Ct
- 204 Chaps Ct
- 4617 Hidden Glen Dr
- 4599 Donegal Way
- 4590 Donegal Way
- 2960 Almondwood Place
- 3001 Oakley Rd
- 4554 Donegal Way
- 3625 Leafwood Cir
- 5010 Neroly Rd
- 2844 Bluebell Cir
- 102 Sonora Ct
- 4480 Le Conte Cir
- 4472 Le Conte Cir
- 4477 Spire St
- 4481 Spire St
- 4473 Spire St
- 4484 Le Conte Cir
- 4468 Le Conte Cir
- 4468 Le Conte Cl
- 4465 Spire St
- 4485 Spire St
- 4479 Le Conte Cir
- 4475 Le Conte Cir
- 4469 Spire St
- 4483 Le Conte Cir
- 4488 Le Conte Cir
- 4471 Le Conte Cir
- 4489 Spire St
- 4487 Le Conte Cir
- 4467 Le Conte Cir
- 4492 Le Conte Cir