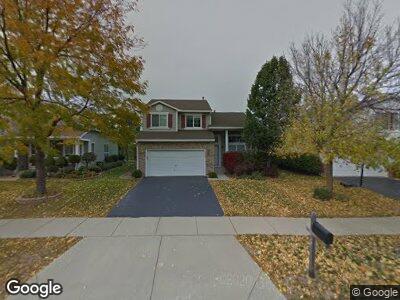
4476 W Butternut Ln Waukegan, IL 60085
Southwest Waukegan NeighborhoodEstimated Value: $318,000 - $409,000
4
Beds
3
Baths
1,564
Sq Ft
$227/Sq Ft
Est. Value
About This Home
This home is located at 4476 W Butternut Ln, Waukegan, IL 60085 and is currently estimated at $354,737, approximately $226 per square foot. 4476 W Butternut Ln is a home located in Lake County with nearby schools including Woodland Primary School, Woodland Elementary School, and Woodland Intermediate School.
Ownership History
Date
Name
Owned For
Owner Type
Purchase Details
Closed on
May 29, 2002
Sold by
Johnson Erik E and Johnson Judy A
Bought by
Little Roger D
Current Estimated Value
Home Financials for this Owner
Home Financials are based on the most recent Mortgage that was taken out on this home.
Original Mortgage
$150,000
Interest Rate
6.54%
Purchase Details
Closed on
Mar 31, 1999
Sold by
Fonseca Americo R and Fonseca Cecelia C
Bought by
Johnson Erik E
Home Financials for this Owner
Home Financials are based on the most recent Mortgage that was taken out on this home.
Original Mortgage
$157,500
Interest Rate
7.17%
Mortgage Type
Stand Alone First
Purchase Details
Closed on
Nov 22, 1996
Sold by
Pinnacle Corp
Bought by
Johnson Erik E and Fonseca Americo R
Home Financials for this Owner
Home Financials are based on the most recent Mortgage that was taken out on this home.
Original Mortgage
$155,777
Interest Rate
7.94%
Mortgage Type
FHA
Create a Home Valuation Report for This Property
The Home Valuation Report is an in-depth analysis detailing your home's value as well as a comparison with similar homes in the area
Home Values in the Area
Average Home Value in this Area
Purchase History
| Date | Buyer | Sale Price | Title Company |
|---|---|---|---|
| Little Roger D | $208,000 | -- | |
| Johnson Erik E | -- | Ticor Title | |
| Johnson Erik E | $156,000 | Chicago Title Insurance Co |
Source: Public Records
Mortgage History
| Date | Status | Borrower | Loan Amount |
|---|---|---|---|
| Open | Little Roger D | $78,600 | |
| Closed | Little Roger D | $131,250 | |
| Closed | Little Roger D | $149,600 | |
| Closed | Little Roger D | $150,600 | |
| Previous Owner | Little Roger D | $150,000 | |
| Previous Owner | Johnson Erik E | $25,000 | |
| Previous Owner | Johnson Erik E | $157,500 | |
| Previous Owner | Johnson Erik E | $155,777 |
Source: Public Records
Tax History Compared to Growth
Tax History
| Year | Tax Paid | Tax Assessment Tax Assessment Total Assessment is a certain percentage of the fair market value that is determined by local assessors to be the total taxable value of land and additions on the property. | Land | Improvement |
|---|---|---|---|---|
| 2023 | $8,993 | $93,541 | $13,306 | $80,235 |
| 2022 | $8,993 | $78,844 | $13,302 | $65,542 |
| 2021 | $8,359 | $75,680 | $12,768 | $62,912 |
| 2020 | $8,217 | $73,820 | $12,454 | $61,366 |
| 2019 | $8,105 | $71,676 | $12,092 | $59,584 |
| 2018 | $6,787 | $60,920 | $11,898 | $49,022 |
| 2017 | $6,729 | $59,174 | $11,557 | $47,617 |
| 2016 | $6,634 | $56,539 | $11,042 | $45,497 |
| 2015 | $6,547 | $53,622 | $10,472 | $43,150 |
| 2014 | $7,277 | $50,732 | $10,330 | $40,402 |
| 2012 | $6,776 | $60,046 | $10,418 | $49,628 |
Source: Public Records
Map
Nearby Homes
- 1250 S Oplaine Rd
- 1095 S Pleasant Hill Gate
- 1063 S Pleasant Hill Gate
- 1461 S Candlestick Way
- 1467 S Candlestick Way Unit 3153
- 4390 W Parkway Ave
- 4491 W Westchester Ln
- 4437-4495 W Kennedy Dr
- 4655 Celano Dr
- 4420 Eastwood Ave
- 4563 W Wren Ct
- 4461 Longmeadow Dr
- 33564 Greenleaf St
- 14429 Dan Patch Ln
- 468 Tanglewood Dr
- 460 Sunnyside Ave
- Lot 2 Greenview Ave
- 450 Tanglewood Dr
- 397 Briarwood Ct
- 372 White Oak Ct
- 4476 W Butternut Ln
- 4468 W Butternut Ln
- 4484 W Butternut Ln
- 4460 W Butternut Ln
- 4492 W Butternut Ln Unit 2
- 4500 W Butternut Ln
- 4471 W Butternut Ln
- 4481 W Butternut Ln
- 4491 W Butternut Ln
- 4463 W Butternut Ln
- 4444 W Butternut Ln
- 4508 W Butternut Ln
- 4455 W Butternut Ln
- 4501 W Butternut Ln
- 4449 W Butternut Ln
- 4516 W Butternut Ln
- 4436 W Butternut Ln
- 4507 W Butternut Ln
- 1246 S Pleasant Hill Gate
- 4402 W Quill Ln