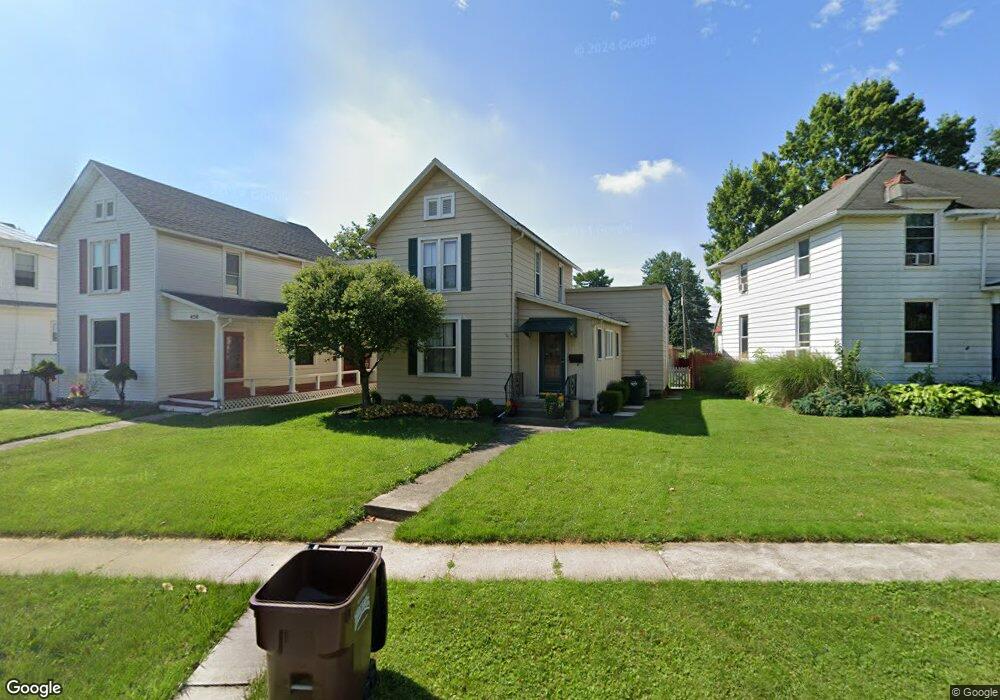
448 E Perry St Tiffin, OH 44883
Estimated Value: $125,000 - $151,000
4
Beds
1
Bath
1,381
Sq Ft
$101/Sq Ft
Est. Value
About This Home
This home is located at 448 E Perry St, Tiffin, OH 44883 and is currently estimated at $138,961, approximately $100 per square foot. 448 E Perry St is a home located in Seneca County with nearby schools including Columbian High School, Calvert High School, and Calvert Catholic Elementary School.
Ownership History
Date
Name
Owned For
Owner Type
Purchase Details
Closed on
May 2, 2024
Sold by
Shuff Lois M and Walters Donna J
Bought by
Montz Leah R
Current Estimated Value
Home Financials for this Owner
Home Financials are based on the most recent Mortgage that was taken out on this home.
Original Mortgage
$114,945
Outstanding Balance
$112,762
Interest Rate
6.79%
Mortgage Type
New Conventional
Estimated Equity
$26,199
Purchase Details
Closed on
Dec 18, 2017
Sold by
Shuff Lois M
Bought by
Shuff Charles Leon and Walters Donna Jean
Purchase Details
Closed on
Jul 2, 1990
Create a Home Valuation Report for This Property
The Home Valuation Report is an in-depth analysis detailing your home's value as well as a comparison with similar homes in the area
Home Values in the Area
Average Home Value in this Area
Purchase History
| Date | Buyer | Sale Price | Title Company |
|---|---|---|---|
| Montz Leah R | $118,500 | Assured Title | |
| Shuff Charles Leon | -- | None Available | |
| -- | -- | -- |
Source: Public Records
Mortgage History
| Date | Status | Borrower | Loan Amount |
|---|---|---|---|
| Open | Montz Leah R | $114,945 |
Source: Public Records
Tax History
| Year | Tax Paid | Tax Assessment Tax Assessment Total Assessment is a certain percentage of the fair market value that is determined by local assessors to be the total taxable value of land and additions on the property. | Land | Improvement |
|---|---|---|---|---|
| 2025 | $1,267 | $37,360 | $5,740 | $31,620 |
| 2024 | $953 | $37,360 | $5,740 | $31,620 |
| 2023 | $953 | $37,360 | $5,740 | $31,620 |
| 2022 | $776 | $27,800 | $4,880 | $22,920 |
| 2021 | $782 | $27,800 | $4,880 | $22,920 |
| 2020 | $797 | $27,801 | $4,879 | $22,922 |
| 2019 | $770 | $26,572 | $4,781 | $21,791 |
| 2018 | $772 | $26,572 | $4,781 | $21,791 |
| 2017 | $780 | $26,572 | $4,781 | $21,791 |
| 2016 | $684 | $24,770 | $4,638 | $20,132 |
| 2015 | $677 | $24,770 | $4,638 | $20,132 |
| 2014 | $637 | $24,770 | $4,638 | $20,132 |
| 2013 | $692 | $25,508 | $4,781 | $20,727 |
Source: Public Records
Map
Nearby Homes
Your Personal Tour Guide
Ask me questions while you tour the home.