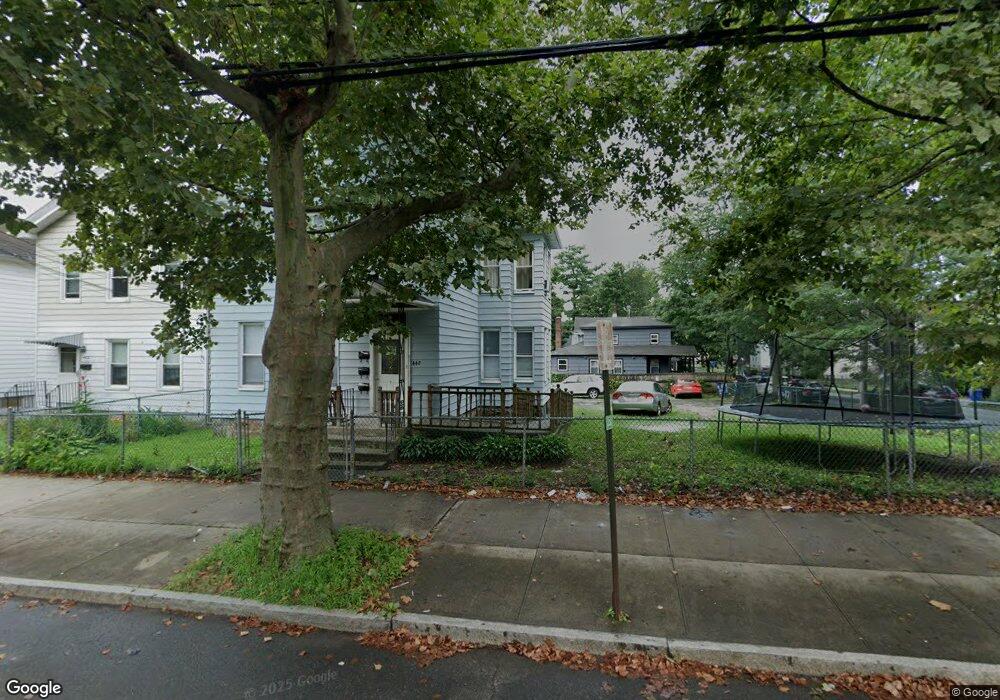
448 Ferry St Unit 3 New Haven, CT 06513
Fair Haven NeighborhoodEstimated Value: $322,964 - $415,000
1
Bed
1
Bath
3,159
Sq Ft
$122/Sq Ft
Est. Value
About This Home
This home is located at 448 Ferry St Unit 3, New Haven, CT 06513 and is currently estimated at $385,991, approximately $122 per square foot. 448 Ferry St Unit 3 is a home located in New Haven County with nearby schools including Clinton Avenue School, Elm City College Preparatory School, and St Francis & St Rose Of Lima School.
Ownership History
Date
Name
Owned For
Owner Type
Purchase Details
Closed on
Nov 13, 2022
Sold by
Dibendetto Kamila
Bought by
Patino Edgar
Current Estimated Value
Purchase Details
Closed on
Mar 3, 2014
Sold by
Hernandez Mary L
Bought by
Dibenedetto Kamila
Purchase Details
Closed on
Oct 8, 2013
Sold by
Hernandez Mary L
Bought by
Dibenedetto Kamila
Create a Home Valuation Report for This Property
The Home Valuation Report is an in-depth analysis detailing your home's value as well as a comparison with similar homes in the area
Home Values in the Area
Average Home Value in this Area
Purchase History
| Date | Buyer | Sale Price | Title Company |
|---|---|---|---|
| Patino Edgar | $310,000 | None Available | |
| Patino Edgar | $310,000 | None Available | |
| Dibenedetto Kamila | $95,000 | -- | |
| Dibenedetto Kamila | $95,000 | -- | |
| Dibenedetto Kamila | $95,000 | -- | |
| Dibenedetto Kamila | $95,000 | -- |
Source: Public Records
Tax History Compared to Growth
Tax History
| Year | Tax Paid | Tax Assessment Tax Assessment Total Assessment is a certain percentage of the fair market value that is determined by local assessors to be the total taxable value of land and additions on the property. | Land | Improvement |
|---|---|---|---|---|
| 2025 | $6,492 | $164,780 | $28,700 | $136,080 |
| 2024 | $6,344 | $164,780 | $28,700 | $136,080 |
| 2023 | $6,130 | $164,780 | $28,700 | $136,080 |
| 2022 | $6,898 | $173,530 | $28,700 | $144,830 |
| 2021 | $4,463 | $101,710 | $22,960 | $78,750 |
| 2020 | $4,463 | $101,710 | $22,960 | $78,750 |
| 2019 | $4,371 | $101,710 | $22,960 | $78,750 |
| 2018 | $4,371 | $101,710 | $22,960 | $78,750 |
| 2017 | $3,934 | $101,710 | $22,960 | $78,750 |
| 2016 | $3,260 | $78,470 | $15,330 | $63,140 |
| 2015 | $3,260 | $78,470 | $15,330 | $63,140 |
| 2014 | $3,260 | $78,470 | $15,330 | $63,140 |
Source: Public Records
Map
Nearby Homes