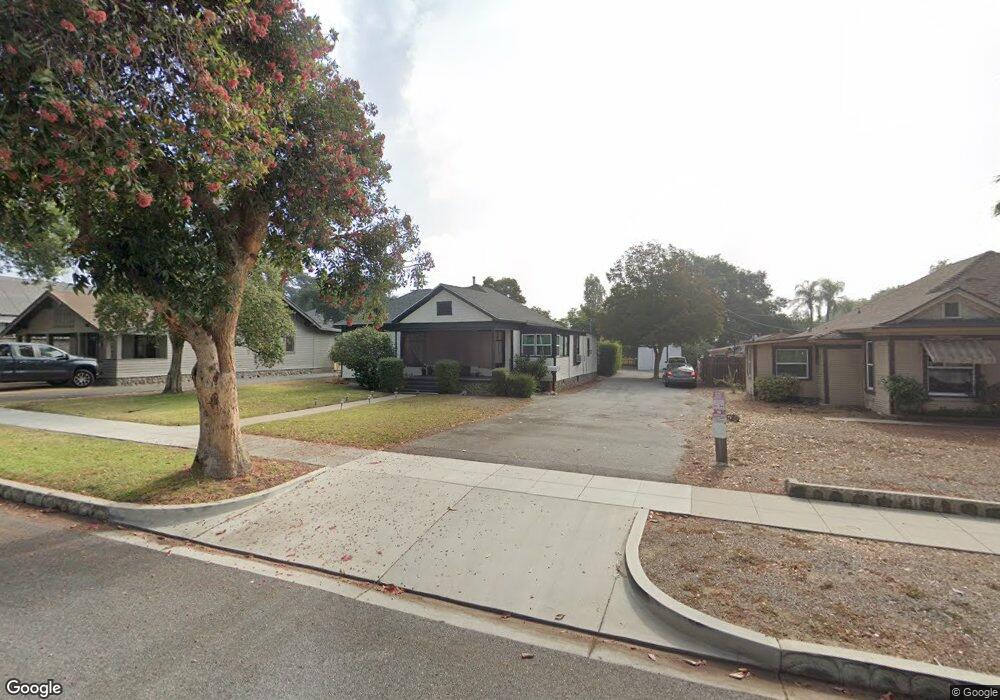
448 N 3rd Ave Upland, CA 91786
Estimated Value: $721,000 - $935,000
3
Beds
4
Baths
1,352
Sq Ft
$595/Sq Ft
Est. Value
About This Home
This home is located at 448 N 3rd Ave, Upland, CA 91786 and is currently estimated at $805,015, approximately $595 per square foot. 448 N 3rd Ave is a home located in San Bernardino County with nearby schools including Upland Elementary School, Upland Junior High School, and Upland High School.
Ownership History
Date
Name
Owned For
Owner Type
Purchase Details
Closed on
Jul 27, 2024
Sold by
Davalos Jesus and Davalos Gloria
Bought by
Jg Davalos 2024 Family Trust and Davalos
Current Estimated Value
Purchase Details
Closed on
May 4, 2018
Sold by
Davalos Jesus and Davalos Gloria
Bought by
Davalos Jesus and Davalos Gloria
Purchase Details
Closed on
Oct 16, 2002
Sold by
Martin William E
Bought by
Davalos Jesus and Davalos Gloria
Home Financials for this Owner
Home Financials are based on the most recent Mortgage that was taken out on this home.
Original Mortgage
$129,000
Interest Rate
5.86%
Create a Home Valuation Report for This Property
The Home Valuation Report is an in-depth analysis detailing your home's value as well as a comparison with similar homes in the area
Home Values in the Area
Average Home Value in this Area
Purchase History
| Date | Buyer | Sale Price | Title Company |
|---|---|---|---|
| Jg Davalos 2024 Family Trust | -- | None Listed On Document | |
| Davalos Jesus | -- | None Listed On Document | |
| Davalos Jesus | -- | None Available | |
| Davalos Jesus | $229,000 | Fidelity National Title Ins |
Source: Public Records
Mortgage History
| Date | Status | Borrower | Loan Amount |
|---|---|---|---|
| Previous Owner | Davalos Jesus | $129,000 |
Source: Public Records
Tax History
| Year | Tax Paid | Tax Assessment Tax Assessment Total Assessment is a certain percentage of the fair market value that is determined by local assessors to be the total taxable value of land and additions on the property. | Land | Improvement |
|---|---|---|---|---|
| 2025 | $3,773 | $331,671 | $115,870 | $215,801 |
| 2024 | $3,654 | $325,168 | $113,598 | $211,570 |
| 2023 | $3,598 | $318,793 | $111,371 | $207,422 |
| 2022 | $3,520 | $312,542 | $109,187 | $203,355 |
| 2021 | $3,514 | $306,414 | $107,046 | $199,368 |
| 2020 | $3,419 | $303,272 | $105,948 | $197,324 |
| 2019 | $3,408 | $297,326 | $103,871 | $193,455 |
| 2018 | $3,326 | $291,496 | $101,834 | $189,662 |
| 2017 | $3,231 | $285,780 | $99,837 | $185,943 |
| 2016 | $3,027 | $280,176 | $97,879 | $182,297 |
| 2015 | $2,959 | $275,968 | $96,409 | $179,559 |
| 2014 | $2,883 | $270,562 | $94,520 | $176,042 |
Source: Public Records
Map
Nearby Homes
Your Personal Tour Guide
Ask me questions while you tour the home.