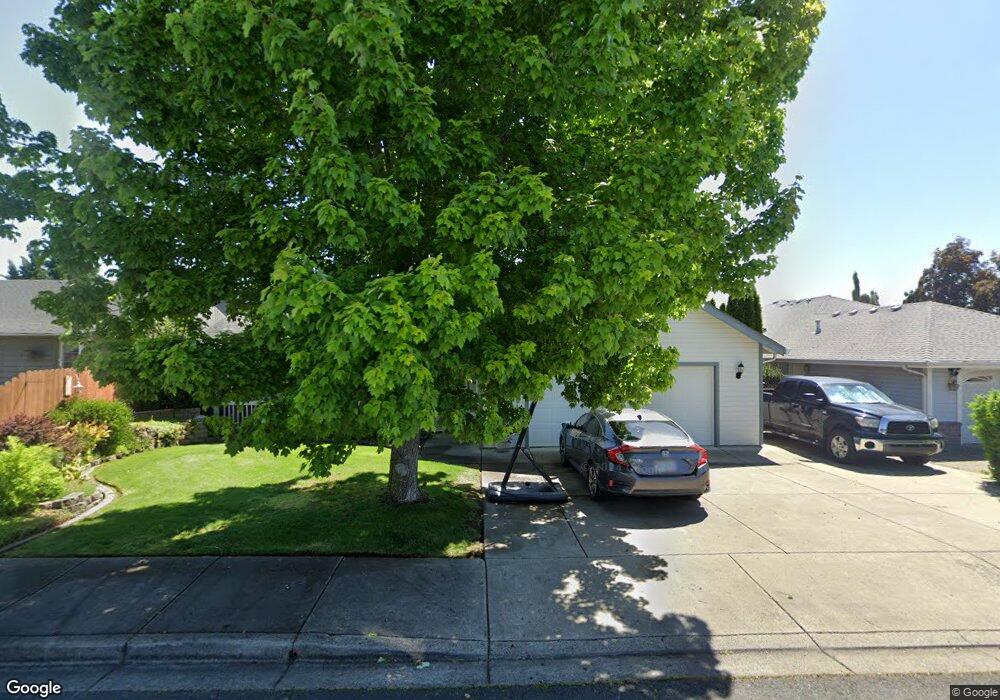
448 Phyllis Dr Eagle Point, OR 97524
Estimated Value: $394,000 - $446,000
3
Beds
2
Baths
1,627
Sq Ft
$256/Sq Ft
Est. Value
About This Home
This home is located at 448 Phyllis Dr, Eagle Point, OR 97524 and is currently estimated at $416,625, approximately $256 per square foot. 448 Phyllis Dr is a home located in Jackson County with nearby schools including Eagle Rock Elementary School, Eagle Point Middle School, and White Mountain Middle School.
Ownership History
Date
Name
Owned For
Owner Type
Purchase Details
Closed on
Jun 22, 2005
Sold by
Williams Mark E and Williams Cheryl J
Bought by
Silvey Joshua R and Silvey Robin
Current Estimated Value
Home Financials for this Owner
Home Financials are based on the most recent Mortgage that was taken out on this home.
Original Mortgage
$200,000
Outstanding Balance
$101,663
Interest Rate
5.65%
Mortgage Type
Fannie Mae Freddie Mac
Estimated Equity
$314,962
Purchase Details
Closed on
Nov 20, 2003
Sold by
Brooks Torry A and Brooks Daphne L
Bought by
Williams Mark E and Williams Cheryl J
Home Financials for this Owner
Home Financials are based on the most recent Mortgage that was taken out on this home.
Original Mortgage
$172,463
Interest Rate
5.89%
Mortgage Type
FHA
Purchase Details
Closed on
Dec 15, 2002
Sold by
Stonebilt Inc
Bought by
Brooks Torry A and Brooks Daphne L
Create a Home Valuation Report for This Property
The Home Valuation Report is an in-depth analysis detailing your home's value as well as a comparison with similar homes in the area
Home Values in the Area
Average Home Value in this Area
Purchase History
| Date | Buyer | Sale Price | Title Company |
|---|---|---|---|
| Silvey Joshua R | $268,500 | Amerititle | |
| Williams Mark E | $175,000 | Lawyers Title Insurance Corp | |
| Brooks Torry A | $43,000 | Lawyers Title Insurance Corp |
Source: Public Records
Mortgage History
| Date | Status | Borrower | Loan Amount |
|---|---|---|---|
| Open | Silvey Joshua R | $200,000 | |
| Previous Owner | Williams Mark E | $172,463 |
Source: Public Records
Tax History
| Year | Tax Paid | Tax Assessment Tax Assessment Total Assessment is a certain percentage of the fair market value that is determined by local assessors to be the total taxable value of land and additions on the property. | Land | Improvement |
|---|---|---|---|---|
| 2026 | $2,811 | $206,620 | -- | -- |
| 2025 | $2,745 | $200,610 | $66,890 | $133,720 |
| 2024 | $2,745 | $194,770 | $64,940 | $129,830 |
| 2023 | $2,652 | $189,100 | $63,050 | $126,050 |
| 2022 | $2,580 | $189,100 | $63,050 | $126,050 |
| 2021 | $2,503 | $183,600 | $61,220 | $122,380 |
| 2020 | $2,659 | $178,260 | $59,430 | $118,830 |
| 2019 | $2,619 | $168,030 | $56,020 | $112,010 |
| 2018 | $2,569 | $163,140 | $54,390 | $108,750 |
| 2017 | $2,506 | $163,140 | $54,390 | $108,750 |
| 2016 | $2,457 | $153,780 | $51,270 | $102,510 |
| 2015 | $2,377 | $153,780 | $51,270 | $102,510 |
| 2014 | $2,309 | $144,970 | $48,320 | $96,650 |
Source: Public Records
Map
Nearby Homes
- 911 Stonewater Dr
- 917 Stonewater Dr
- 1023 Highlands Dr
- 912 Stonewater Dr
- 925 Sellwood Dr
- 250 Tierra Cir
- 403 N Deanjou Ave
- 407 N Deanjou Ave
- 110 Linton Way
- 71 Tracy Ave Unit 71 & 73
- 426 Westminster Dr
- 208 Northview Dr Unit 1B
- 438 Westminster Dr
- 945 Win Way
- 1017 Havenwood Dr
- 584 Barton Rd
- 190 Barton Rd
- 318 S Buchanan Ave
- 700 Nottingham Terrace
- 712 Nottingham Terrace
- 448 Phyllis Dr Unit 19
- 454 Phyllis Dr Unit 18
- 454 Phyllis Dr
- 426 Phyllis Dr Unit 20
- 426 Phyllis Dr
- 227 Dianne Way
- 227 Diane Way
- 233 Diane Way
- 233 Dianne Way
- 460 Phyllis Dr Unit 17
- 460 Phyllis Dr
- 408 Phyllis Dr Unit 21
- 408 Phyllis Dr
- 453 Phyllis Dr Unit 11
- 453 Phyllis Dr
- 447 Phyllis Dr Unit 10
- 447 Phyllis Dr
- 239 Diane Way
- 239 Dianne Way
- 439 Phyllis Dr Unit 9
Your Personal Tour Guide
Ask me questions while you tour the home.