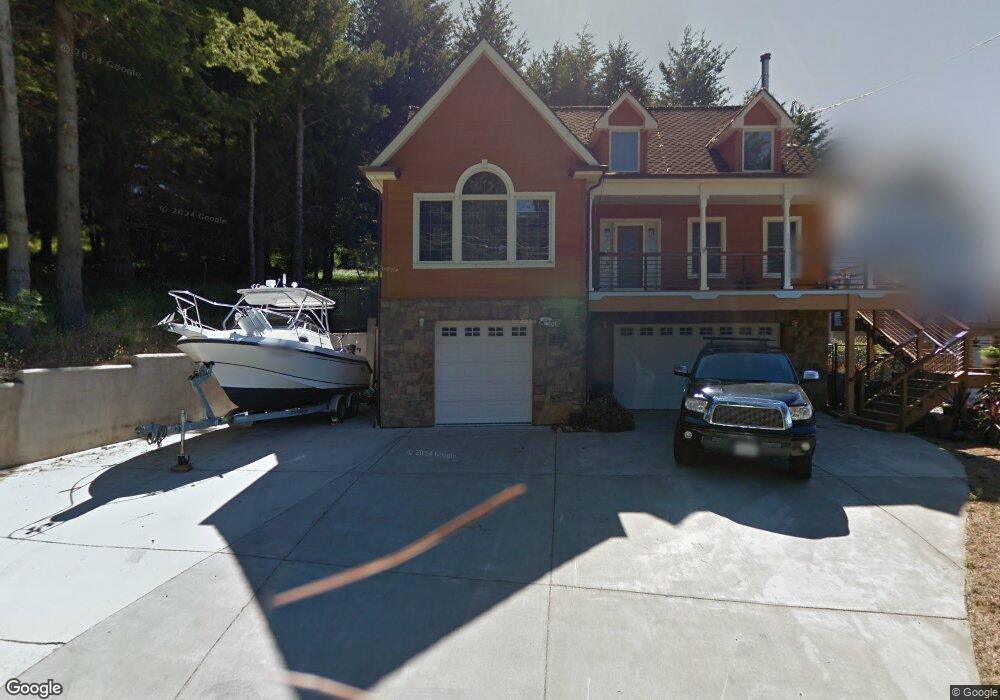
448 Seafoam Rd Whitethorn, CA 95589
Shelter Cove NeighborhoodEstimated Value: $448,000 - $580,000
3
Beds
3
Baths
2,200
Sq Ft
$224/Sq Ft
Est. Value
About This Home
This home is located at 448 Seafoam Rd, Whitethorn, CA 95589 and is currently estimated at $492,502, approximately $223 per square foot. 448 Seafoam Rd is a home located in Humboldt County.
Ownership History
Date
Name
Owned For
Owner Type
Purchase Details
Closed on
Mar 28, 2022
Sold by
Parker Nicole M
Bought by
Boldt Kaelea
Current Estimated Value
Home Financials for this Owner
Home Financials are based on the most recent Mortgage that was taken out on this home.
Original Mortgage
$275,000
Outstanding Balance
$258,771
Interest Rate
4.42%
Mortgage Type
Seller Take Back
Estimated Equity
$233,731
Purchase Details
Closed on
Apr 5, 2017
Sold by
Smith Marlene A and The R & M Smith Family Trust
Bought by
Parker Nicole M
Purchase Details
Closed on
May 16, 2011
Sold by
Mcclure Charles M and Mcclure Marilyn J
Bought by
Smith Robert G and Smith Marlene A
Purchase Details
Closed on
Dec 31, 2002
Sold by
Tomosawa Francis M and Tomosawa Lillian R
Bought by
Mcclure Charles M and Mcclure Marilyn J
Create a Home Valuation Report for This Property
The Home Valuation Report is an in-depth analysis detailing your home's value as well as a comparison with similar homes in the area
Home Values in the Area
Average Home Value in this Area
Purchase History
| Date | Buyer | Sale Price | Title Company |
|---|---|---|---|
| Boldt Kaelea | $400,000 | Fidelity National Title | |
| Parker Nicole M | -- | None Available | |
| Smith Robert G | $415,000 | Humboldt Land Title Company | |
| Mcclure Charles M | $20,000 | First American Title Ins Co |
Source: Public Records
Mortgage History
| Date | Status | Borrower | Loan Amount |
|---|---|---|---|
| Open | Boldt Kaelea | $275,000 |
Source: Public Records
Tax History Compared to Growth
Tax History
| Year | Tax Paid | Tax Assessment Tax Assessment Total Assessment is a certain percentage of the fair market value that is determined by local assessors to be the total taxable value of land and additions on the property. | Land | Improvement |
|---|---|---|---|---|
| 2025 | $4,783 | $424,483 | $137,957 | $286,526 |
| 2024 | $4,783 | $416,160 | $135,252 | $280,908 |
| 2023 | $4,802 | $408,000 | $132,600 | $275,400 |
| 2022 | $4,240 | $355,433 | $82,022 | $273,411 |
| 2021 | $4,086 | $348,464 | $80,414 | $268,050 |
| 2020 | $4,110 | $344,892 | $79,590 | $265,302 |
| 2019 | $4,012 | $338,130 | $78,030 | $260,100 |
| 2018 | $5,158 | $442,507 | $56,297 | $386,210 |
| 2017 | $4,963 | $433,832 | $55,194 | $378,638 |
| 2016 | $4,934 | $425,326 | $54,112 | $371,214 |
| 2015 | $4,910 | $418,939 | $53,300 | $365,639 |
| 2014 | $4,680 | $410,733 | $52,256 | $358,477 |
Source: Public Records
Map
Nearby Homes
- 37 Spur Ct
- 189 & 177 Hickory Rd
- 26 Rd
- 30 Fir Ct
- 825 Upper Pacific Dr
- 865 Upper Pacific Dr
- 48 Cinch Ct
- 245 Albatross Rd
- 88 Shaker Rd
- 680 Redwood Rd
- 76 Lower Pacific Dr
- 156 Shaker Rd
- 104 Sea View Rd
- 776 Upper Pacific Dr
- 134 Sea View Rd
- 190 Shaker Rd
- 299 Vista Rd
- 541 Redwood Rd
- 79 Sea View Rd
- 529 Redwood Rd