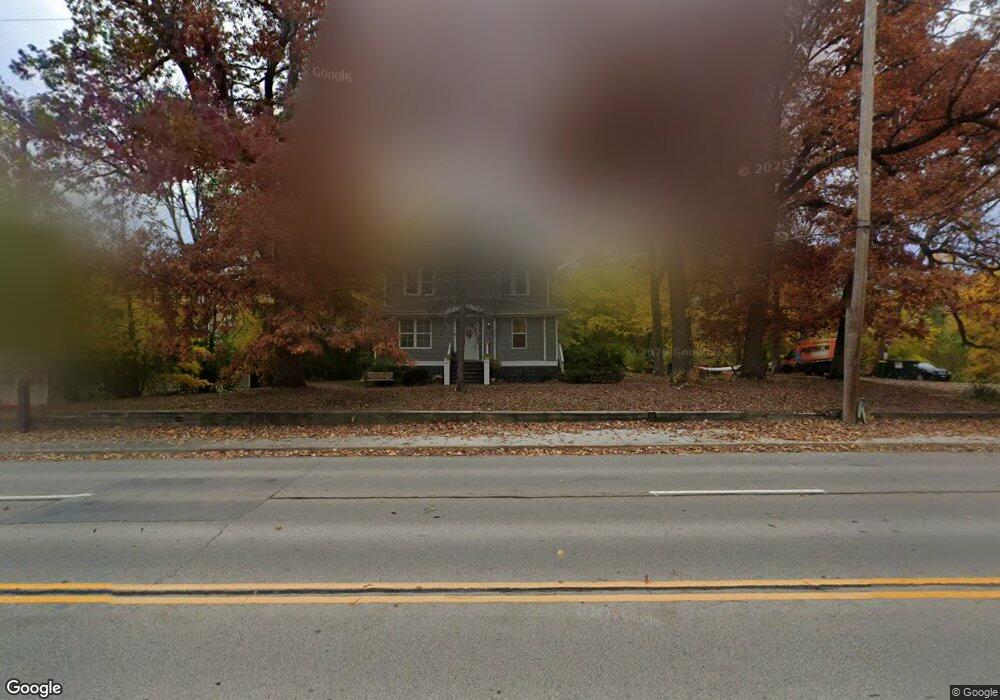
448 W Saint Charles Rd Lombard, IL 60148
North Lombard NeighborhoodEstimated Value: $476,000 - $591,000
--
Bed
--
Bath
2,338
Sq Ft
$234/Sq Ft
Est. Value
About This Home
This home is located at 448 W Saint Charles Rd, Lombard, IL 60148 and is currently estimated at $547,481, approximately $234 per square foot. 448 W Saint Charles Rd is a home located in DuPage County with nearby schools including Park View Elementary School, Pleasant Lane Elementary School, and Madison Elementary School.
Ownership History
Date
Name
Owned For
Owner Type
Purchase Details
Closed on
Apr 29, 2013
Sold by
Us Bank Na
Bought by
Janus Mariusz
Current Estimated Value
Home Financials for this Owner
Home Financials are based on the most recent Mortgage that was taken out on this home.
Original Mortgage
$172,320
Interest Rate
3.25%
Mortgage Type
FHA
Purchase Details
Closed on
Dec 11, 2012
Sold by
Rymarcsuk Ted J
Bought by
Us Bank Na and Sarm 2005 16Xs Trust Fund
Purchase Details
Closed on
Aug 19, 2009
Sold by
Raschk Michael J and Raschk Holly J
Bought by
Raschk Michael J and Raschk Holly J
Purchase Details
Closed on
Jul 11, 2007
Sold by
Kelley Dawn
Bought by
Rymarcsuk Ted
Purchase Details
Closed on
Sep 2, 1999
Sold by
Noble Development Inc
Bought by
Rymarcsuk Ted J and Kelley Dawn R
Purchase Details
Closed on
Dec 23, 1997
Sold by
Noble James O and Noble James S
Bought by
Raschk Michael J and Raschk Holly L
Home Financials for this Owner
Home Financials are based on the most recent Mortgage that was taken out on this home.
Original Mortgage
$164,000
Interest Rate
7.26%
Create a Home Valuation Report for This Property
The Home Valuation Report is an in-depth analysis detailing your home's value as well as a comparison with similar homes in the area
Home Values in the Area
Average Home Value in this Area
Purchase History
| Date | Buyer | Sale Price | Title Company |
|---|---|---|---|
| Janus Mariusz | $175,500 | None Available | |
| Us Bank Na | -- | None Available | |
| Raschk Michael J | -- | None Available | |
| Rymarcsuk Ted | -- | None Available | |
| Rymarcsuk Ted J | $39,000 | -- | |
| Raschk Michael J | -- | Chicago Title Insurance Co |
Source: Public Records
Mortgage History
| Date | Status | Borrower | Loan Amount |
|---|---|---|---|
| Previous Owner | Janus Mariusz | $172,320 | |
| Previous Owner | Raschk Michael J | $164,000 |
Source: Public Records
Tax History Compared to Growth
Tax History
| Year | Tax Paid | Tax Assessment Tax Assessment Total Assessment is a certain percentage of the fair market value that is determined by local assessors to be the total taxable value of land and additions on the property. | Land | Improvement |
|---|---|---|---|---|
| 2024 | $10,592 | $169,325 | $29,576 | $139,749 |
| 2023 | $9,938 | $156,580 | $27,350 | $129,230 |
| 2022 | $9,537 | $150,520 | $26,290 | $124,230 |
| 2021 | $9,192 | $146,780 | $25,640 | $121,140 |
| 2020 | $8,689 | $115,180 | $25,090 | $90,090 |
| 2019 | $8,257 | $109,500 | $23,850 | $85,650 |
| 2018 | $7,696 | $98,720 | $21,500 | $77,220 |
| 2017 | $5,589 | $71,800 | $39,020 | $32,780 |
| 2016 | $5,429 | $67,640 | $36,760 | $30,880 |
| 2015 | $5,123 | $63,020 | $34,250 | $28,770 |
| 2014 | $3,984 | $49,060 | $42,170 | $6,890 |
| 2013 | $3,926 | $49,750 | $42,760 | $6,990 |
Source: Public Records
Map
Nearby Homes
- 23 N West Rd
- 555 W Saint Charles Rd
- 78 N Elizabeth St
- 206 Troy Ln
- 1 S Lincoln Ave Unit 301
- 230 Troy Ln
- 408 S Miller Ct
- 407 S Brewster Ave
- 33 N Main St Unit 11A
- 465 S Elizabeth St
- 25 E Parkside Ave
- 310 S Main St Unit 314
- 107 S Charlotte St
- 105 E Grove St
- 600 W Pleasant Ln Unit A2
- 201 W Crystal Ave
- 21W405 Walnut Rd
- 250 St Regis
- 260 N Charlotte St
- 31 E Washington Blvd
- 452 W Saint Charles Rd
- 442 W Saint Charles Rd
- 456 W Saint Charles Rd
- 436 W Saint Charles Rd
- 5 N Glenview Ave
- 431 W Eugenia St
- 430 W Saint Charles Rd
- 440 W Saint Charles Rd
- 455 W Saint Charles Rd
- 1 S Glenview Ave
- 25 N Glenview Ave
- 427 W Eugenia St
- 500 W Saint Charles Rd
- 11 S Glenview Ave
- 424 W Saint Charles Rd
- 445 W Saint Charles Rd
- 504 W Saint Charles Rd
- 418 W Saint Charles Rd
- 427 W Saint Charles Rd
- 428 W Eugenia St