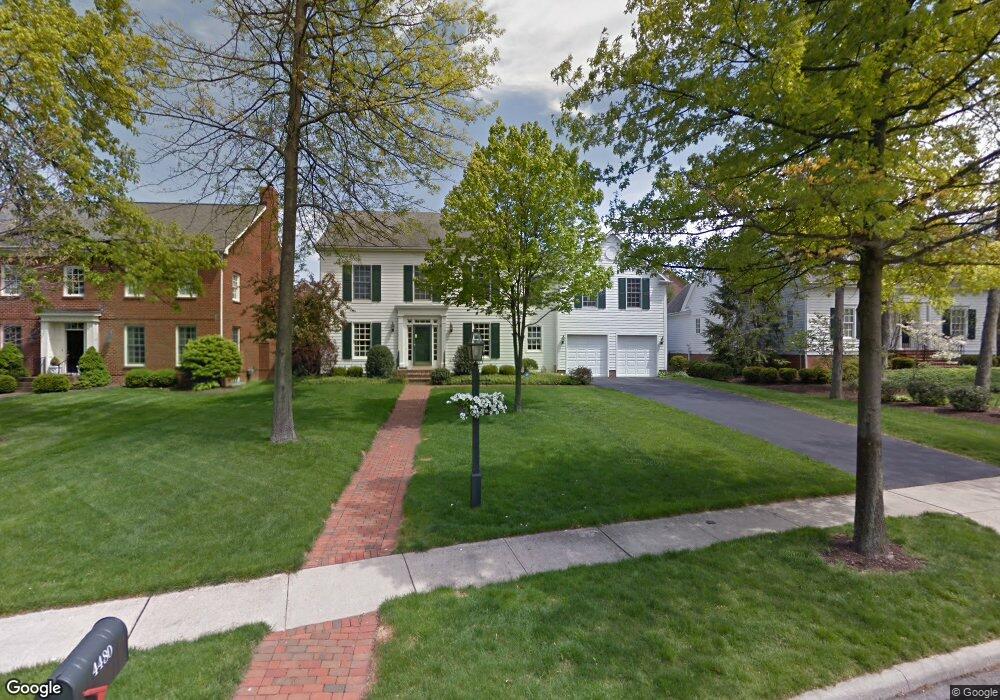
4480 Olmsted Rd New Albany, OH 43054
Estimated Value: $943,232 - $1,056,000
3
Beds
4
Baths
3,696
Sq Ft
$272/Sq Ft
Est. Value
About This Home
This home is located at 4480 Olmsted Rd, New Albany, OH 43054 and is currently estimated at $1,003,808, approximately $271 per square foot. 4480 Olmsted Rd is a home located in Franklin County with nearby schools including New Albany Primary School, New Albany Intermediate School, and New Albany Middle School.
Ownership History
Date
Name
Owned For
Owner Type
Purchase Details
Closed on
Sep 29, 2011
Sold by
Jarrell William A and Jarrell Carolle A
Bought by
Thurston James D and Morgan Emma
Current Estimated Value
Home Financials for this Owner
Home Financials are based on the most recent Mortgage that was taken out on this home.
Original Mortgage
$285,000
Outstanding Balance
$194,756
Interest Rate
4.14%
Mortgage Type
New Conventional
Estimated Equity
$809,052
Purchase Details
Closed on
Sep 9, 1996
Sold by
Bob Webb Builders Inc
Bought by
Jarrell William A and Jarrell Carole A
Home Financials for this Owner
Home Financials are based on the most recent Mortgage that was taken out on this home.
Original Mortgage
$255,000
Interest Rate
7.25%
Mortgage Type
New Conventional
Purchase Details
Closed on
Feb 29, 1996
Sold by
New Albany Co Ltd Ptns
Bought by
Bob Webb Builders Inc
Home Financials for this Owner
Home Financials are based on the most recent Mortgage that was taken out on this home.
Original Mortgage
$260,000
Interest Rate
7.07%
Mortgage Type
New Conventional
Create a Home Valuation Report for This Property
The Home Valuation Report is an in-depth analysis detailing your home's value as well as a comparison with similar homes in the area
Home Values in the Area
Average Home Value in this Area
Purchase History
| Date | Buyer | Sale Price | Title Company |
|---|---|---|---|
| Thurston James D | $385,000 | Stewart Tit | |
| Jarrell William A | $354,082 | -- | |
| Bob Webb Builders Inc | $65,000 | -- |
Source: Public Records
Mortgage History
| Date | Status | Borrower | Loan Amount |
|---|---|---|---|
| Open | Thurston James D | $285,000 | |
| Closed | Jarrell William A | $255,000 | |
| Previous Owner | Bob Webb Builders Inc | $260,000 |
Source: Public Records
Tax History Compared to Growth
Tax History
| Year | Tax Paid | Tax Assessment Tax Assessment Total Assessment is a certain percentage of the fair market value that is determined by local assessors to be the total taxable value of land and additions on the property. | Land | Improvement |
|---|---|---|---|---|
| 2024 | $14,785 | $237,650 | $77,000 | $160,650 |
| 2023 | $14,226 | $237,650 | $77,000 | $160,650 |
| 2022 | $12,753 | $164,790 | $55,130 | $109,660 |
| 2021 | $12,273 | $164,790 | $55,130 | $109,660 |
| 2020 | $12,272 | $164,790 | $55,130 | $109,660 |
| 2019 | $12,744 | $156,660 | $52,500 | $104,160 |
| 2018 | $12,809 | $156,660 | $52,500 | $104,160 |
| 2017 | $12,770 | $156,660 | $52,500 | $104,160 |
| 2016 | $13,001 | $147,290 | $36,020 | $111,270 |
| 2015 | $13,025 | $147,290 | $36,020 | $111,270 |
| 2014 | $12,212 | $147,290 | $36,020 | $111,270 |
| 2013 | $6,285 | $140,280 | $34,300 | $105,980 |
Source: Public Records
Map
Nearby Homes
- 5950 Johnstown Rd
- 5945 Johnstown Rd
- 7 Richmond Square
- 14 Richmond Square
- 115 Keswick Dr
- 105 Keswick Dr
- 7362 Tottenham Place
- 6929 Clivdon Mews
- 4135 High Grove Crest
- 7030 Hanby's Loop
- 3637 Head of Pond Rd
- 7747 Sutton Place
- 6834 Cedar Brook Glen
- 6590 Wheatly Rd
- 6813 Ridge Rock Dr Unit 14
- 5510 Steele Ct
- 6540 Wheatly Rd Unit LOT 701
- 3377 Abberley Dr Unit LOT 902
- 6544 Wheatly Rd Unit LOT 702
- 4774 Bosk Dr
- 4490 Olmsted Rd
- 4470 Olmsted Rd
- 7721 Aspinwall N
- 7722 Leverett Park
- 4479 Olmsted Rd
- 4452 Olmsted Rd
- 0 Leverette Park Unit L101
- 7704 Aspinwall N
- 7714 Aspinwall N
- 7694 Aspinwall N
- 4473 Ackerly Farm Rd
- 4469 Ackerly Farm Rd
- 4459 Olmsted Rd
- 7682 Aspinwall N
- 7719 Leverett Park
- 7726 Aspinwall N
- 4440 Olmsted Rd
- 7668 Aspinwall N
- 4447 Olmsted Rd
- 4480 Middle Aspinwall