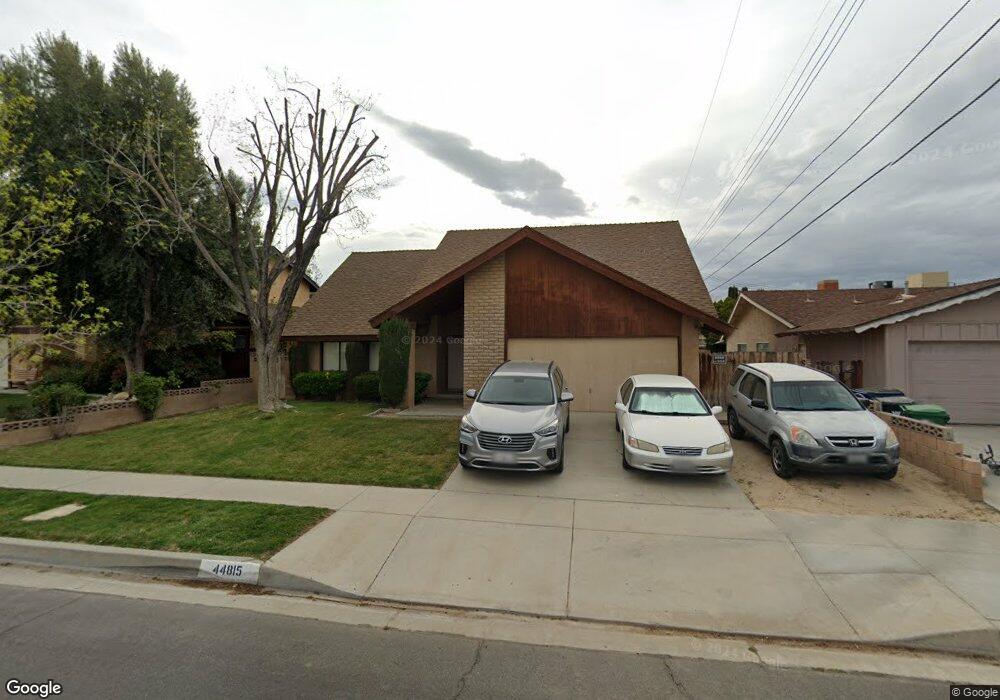
44815 16th St W Lancaster, CA 93534
Central Lancaster NeighborhoodEstimated Value: $512,009 - $607,000
4
Beds
3
Baths
2,678
Sq Ft
$205/Sq Ft
Est. Value
About This Home
This home is located at 44815 16th St W, Lancaster, CA 93534 and is currently estimated at $550,002, approximately $205 per square foot. 44815 16th St W is a home located in Los Angeles County with nearby schools including Monte Vista Elementary School, Amargosa Creek Middle School, and Lancaster High School.
Ownership History
Date
Name
Owned For
Owner Type
Purchase Details
Closed on
Aug 17, 2001
Sold by
Hamm June Ali and Hamm Frederick L
Bought by
Hamm June Ali
Current Estimated Value
Home Financials for this Owner
Home Financials are based on the most recent Mortgage that was taken out on this home.
Original Mortgage
$21,456
Outstanding Balance
$8,406
Interest Rate
7.21%
Estimated Equity
$541,596
Purchase Details
Closed on
Sep 26, 1995
Sold by
Federal National Mortgage Association
Bought by
High June Ali
Home Financials for this Owner
Home Financials are based on the most recent Mortgage that was taken out on this home.
Original Mortgage
$117,100
Outstanding Balance
$821
Interest Rate
7.59%
Estimated Equity
$549,181
Purchase Details
Closed on
Jul 11, 1995
Sold by
Lacuesta Alfredo L and Lacuesta Rebecca
Bought by
Federal National Mortgage Association
Create a Home Valuation Report for This Property
The Home Valuation Report is an in-depth analysis detailing your home's value as well as a comparison with similar homes in the area
Home Values in the Area
Average Home Value in this Area
Purchase History
| Date | Buyer | Sale Price | Title Company |
|---|---|---|---|
| Hamm June Ali | -- | Fidelity National Title | |
| High June Ali | $120,500 | First American Title Co | |
| Federal National Mortgage Association | $143,980 | First Southwestern Title |
Source: Public Records
Mortgage History
| Date | Status | Borrower | Loan Amount |
|---|---|---|---|
| Open | Hamm June Ali | $21,456 | |
| Open | High June Ali | $117,100 |
Source: Public Records
Tax History Compared to Growth
Tax History
| Year | Tax Paid | Tax Assessment Tax Assessment Total Assessment is a certain percentage of the fair market value that is determined by local assessors to be the total taxable value of land and additions on the property. | Land | Improvement |
|---|---|---|---|---|
| 2025 | $3,967 | $219,253 | $33,207 | $186,046 |
| 2024 | $3,967 | $214,955 | $32,556 | $182,399 |
| 2023 | $3,885 | $210,741 | $31,918 | $178,823 |
| 2022 | $3,682 | $206,610 | $31,293 | $175,317 |
| 2021 | $3,280 | $202,560 | $30,680 | $171,880 |
| 2019 | $3,186 | $196,554 | $29,771 | $166,783 |
| 2018 | $3,129 | $192,701 | $29,188 | $163,513 |
| 2016 | $2,949 | $185,219 | $28,055 | $157,164 |
| 2015 | $2,912 | $182,438 | $27,634 | $154,804 |
| 2014 | $2,894 | $178,865 | $27,093 | $151,772 |
Source: Public Records
Map
Nearby Homes
- 0 W 15th St Unit 25003356
- 1728 Linda Ave
- 45029 16th St W
- 0 W Newgrove St
- 44916 18th St W
- 44761 18th St W
- 1735 W Newgrove St
- 1510 W Newgrove St
- 1420 W Jackman St
- 1502 W Newgrove St
- 1414 W Jackman St
- 44705 Lowtree Ave
- 1827 Louise Ave
- 1365 Jenner St
- 1346 W Ivyton St
- 1222 W Kettering St
- 45035 18th St W
- 1202 W Lancaster Blvd
- 45157 16th St W
- 45153 17th St W
- 44817 16th St W
- 44811 16th St W
- 44830 Lorimer Ave
- 44823 16th St W
- 44809 16th St W
- 44822 Lorimer Ave
- 44836 Lorimer Ave
- 1553 Albret St
- 44816 Lorimer Ave
- 1552 W Kildare St
- 1614 W Kildare St
- 44805 16th St W
- 44808 Lorimer Ave
- 1545 Albret St
- 44803 16th St W
- 1544 W Kildare St
- 1554 Albret St
- 44804 Lorimer Ave
- 1548 Albret St
- 1551 W Kildare St