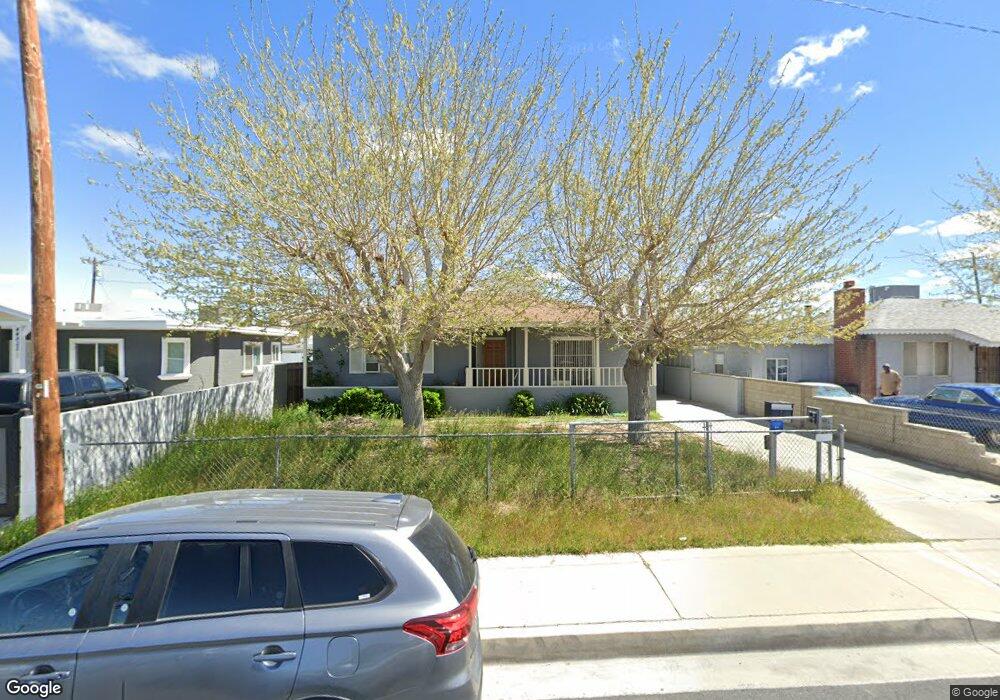
44818 Genoa Ave Lancaster, CA 93534
Central Lancaster NeighborhoodEstimated Value: $363,560 - $379,000
2
Beds
1
Bath
1,176
Sq Ft
$314/Sq Ft
Est. Value
About This Home
This home is located at 44818 Genoa Ave, Lancaster, CA 93534 and is currently estimated at $369,640, approximately $314 per square foot. 44818 Genoa Ave is a home located in Los Angeles County with nearby schools including Sierra Elementary School, Amargosa Creek Middle School, and Antelope Valley High School.
Ownership History
Date
Name
Owned For
Owner Type
Purchase Details
Closed on
Oct 2, 2009
Sold by
Magallanes Griselda
Bought by
Martinez Hector Sanchez
Current Estimated Value
Purchase Details
Closed on
Sep 24, 2009
Sold by
Deutsche Bank National Trust Company
Bought by
Martinez Hector Sanchez
Purchase Details
Closed on
Aug 31, 2009
Sold by
Abril Ernesto
Bought by
Deutsche Bank National Trust Company
Purchase Details
Closed on
May 20, 2004
Sold by
Abril Crystal
Bought by
Abril Ernesto
Home Financials for this Owner
Home Financials are based on the most recent Mortgage that was taken out on this home.
Original Mortgage
$148,200
Interest Rate
6.9%
Mortgage Type
Purchase Money Mortgage
Purchase Details
Closed on
May 6, 2004
Sold by
Isaacs Donald W and Isaacs Joy W
Bought by
Abril Ernesto
Home Financials for this Owner
Home Financials are based on the most recent Mortgage that was taken out on this home.
Original Mortgage
$148,200
Interest Rate
6.9%
Mortgage Type
Purchase Money Mortgage
Create a Home Valuation Report for This Property
The Home Valuation Report is an in-depth analysis detailing your home's value as well as a comparison with similar homes in the area
Home Values in the Area
Average Home Value in this Area
Purchase History
| Date | Buyer | Sale Price | Title Company |
|---|---|---|---|
| Martinez Hector Sanchez | -- | Fidelity Natl Title Ins Co | |
| Martinez Hector Sanchez | $55,000 | Fidelity Natl Title Ins Co | |
| Deutsche Bank National Trust Company | $39,100 | Accommodation | |
| Abril Ernesto | -- | Gateway Title | |
| Abril Ernesto | $156,000 | Gateway Title |
Source: Public Records
Mortgage History
| Date | Status | Borrower | Loan Amount |
|---|---|---|---|
| Previous Owner | Abril Ernesto | $148,200 |
Source: Public Records
Tax History
| Year | Tax Paid | Tax Assessment Tax Assessment Total Assessment is a certain percentage of the fair market value that is determined by local assessors to be the total taxable value of land and additions on the property. | Land | Improvement |
|---|---|---|---|---|
| 2025 | $3,697 | $204,974 | $14,191 | $190,783 |
| 2024 | $3,697 | $200,956 | $13,913 | $187,043 |
| 2023 | $3,618 | $197,017 | $13,641 | $183,376 |
| 2022 | $3,421 | $193,155 | $13,374 | $179,781 |
| 2021 | $3,032 | $189,368 | $13,112 | $176,256 |
| 2019 | $2,945 | $183,753 | $12,724 | $171,029 |
| 2018 | $2,892 | $180,151 | $12,475 | $167,676 |
| 2016 | $2,744 | $173,158 | $11,992 | $161,166 |
| 2015 | $2,709 | $170,558 | $11,812 | $158,746 |
| 2014 | $2,694 | $167,218 | $11,581 | $155,637 |
Source: Public Records
Map
Nearby Homes
- 0 Vac Vic 195 Ste Ave 06 Unit 23-270071
- 0 Vac Vic Avenue F8 75 Stw Unit SR19141185
- 44702 Fig Ave
- 1025 W Newgrove St
- 937 W Norberry St
- 0 W Norberry Unit PW26040894
- 925 W Oldfield St
- 46135 10th St W
- 941 W Oldfield St
- 45021 11th St W
- 45110 Elm Ave
- 44606 Date Ave
- 0 Ave J Corner of Genoa Ave Unit 24003618
- 44705 Lowtree Ave
- 44627 Beech Ave
- 1354 W Jenner St
- 0 Cor Avenue I Fern Ave
- 106 W Avenue I
- 14 SR Sierra Hwy Unit K8
- 665 W Avenue J
- 44822 Genoa Ave
- 44812 Genoa Ave
- 44828 Genoa Ave
- 44806 Genoa Ave Unit 8
- 44806 Genoa Ave
- 44832 Genoa Ave
- 44817 Gadsden Ave
- 863 W Milling St
- 44823 Gadsden Ave
- 44811 Gadsden Ave
- 44829 Gadsden Ave
- 44807 Gadsden Ave
- 44833 Gadsden Ave
- 849 W Milling St
- 44821 Genoa Ave
- 44815 Genoa Ave
- 44809 Genoa Ave
- 44827 Genoa Ave
- 44803 Genoa Ave
- 854 W Milling St
Your Personal Tour Guide
Ask me questions while you tour the home.