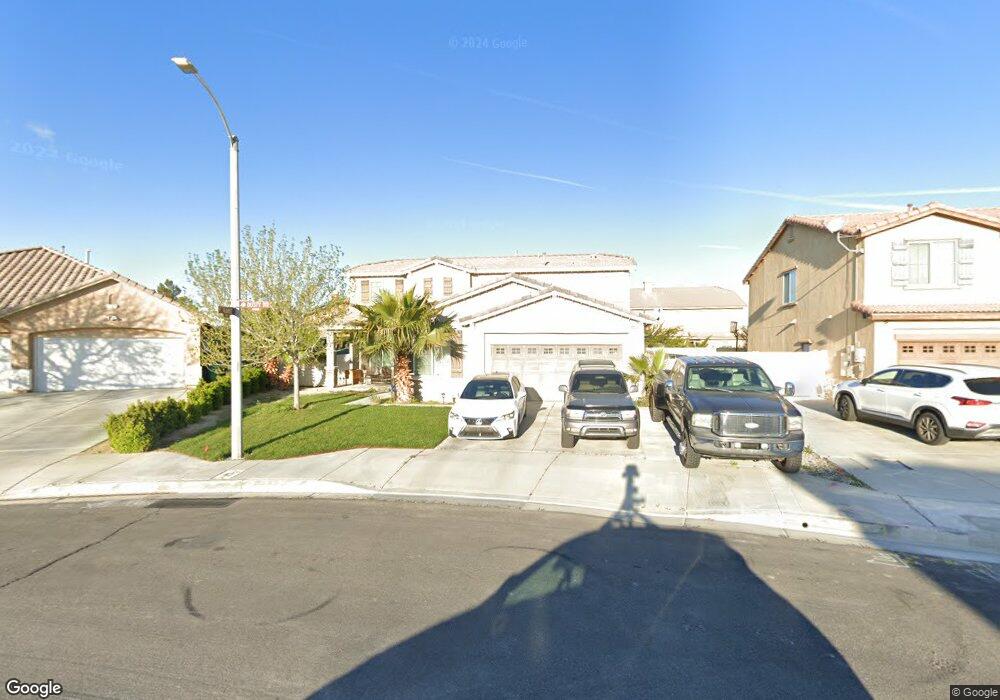
44819 Dusty Rd Lancaster, CA 93536
West Lancaster NeighborhoodEstimated Value: $551,744 - $568,000
4
Beds
3
Baths
2,427
Sq Ft
$229/Sq Ft
Est. Value
About This Home
This home is located at 44819 Dusty Rd, Lancaster, CA 93536 and is currently estimated at $556,686, approximately $229 per square foot. 44819 Dusty Rd is a home located in Los Angeles County with nearby schools including Monte Vista Elementary School, Amargosa Creek Middle School, and Lancaster High School.
Ownership History
Date
Name
Owned For
Owner Type
Purchase Details
Closed on
Dec 7, 2017
Sold by
Mackey Jonathan L
Bought by
Mackey Jonathan L and Lopez Guadalupe
Current Estimated Value
Home Financials for this Owner
Home Financials are based on the most recent Mortgage that was taken out on this home.
Original Mortgage
$345,000
Outstanding Balance
$290,460
Interest Rate
3.94%
Mortgage Type
VA
Estimated Equity
$266,226
Purchase Details
Closed on
Aug 27, 2010
Sold by
Mackey Guadalupe
Bought by
Mackey Jonathan L
Home Financials for this Owner
Home Financials are based on the most recent Mortgage that was taken out on this home.
Original Mortgage
$258,439
Interest Rate
4.52%
Mortgage Type
VA
Purchase Details
Closed on
Jul 20, 2010
Sold by
Beazer Homes Holdings Corp
Bought by
Mackey Jonathan L
Home Financials for this Owner
Home Financials are based on the most recent Mortgage that was taken out on this home.
Original Mortgage
$258,439
Interest Rate
4.52%
Mortgage Type
VA
Create a Home Valuation Report for This Property
The Home Valuation Report is an in-depth analysis detailing your home's value as well as a comparison with similar homes in the area
Home Values in the Area
Average Home Value in this Area
Purchase History
| Date | Buyer | Sale Price | Title Company |
|---|---|---|---|
| Mackey Jonathan L | -- | First American Title | |
| Mackey Jonathan L | -- | Fidelity National Title Co | |
| Mackey Jonathan L | $253,000 | Fidelity National Title Co |
Source: Public Records
Mortgage History
| Date | Status | Borrower | Loan Amount |
|---|---|---|---|
| Open | Mackey Jonathan L | $345,000 | |
| Closed | Mackey Jonathan L | $258,439 |
Source: Public Records
Tax History Compared to Growth
Tax History
| Year | Tax Paid | Tax Assessment Tax Assessment Total Assessment is a certain percentage of the fair market value that is determined by local assessors to be the total taxable value of land and additions on the property. | Land | Improvement |
|---|---|---|---|---|
| 2025 | $3,461 | $324,122 | $80,962 | $243,160 |
| 2024 | $3,461 | $317,768 | $79,375 | $238,393 |
| 2023 | $3,454 | $311,538 | $77,819 | $233,719 |
| 2022 | $3,351 | $305,431 | $76,294 | $229,137 |
| 2021 | $2,939 | $299,444 | $74,799 | $224,645 |
| 2019 | $2,904 | $290,565 | $72,582 | $217,983 |
| 2018 | $4,489 | $284,868 | $71,159 | $213,709 |
| 2017 | $4,268 | $279,283 | $69,764 | $209,519 |
| 2016 | $4,076 | $273,808 | $68,397 | $205,411 |
| 2015 | $4,023 | $269,696 | $67,370 | $202,326 |
| 2014 | $3,980 | $264,414 | $66,051 | $198,363 |
Source: Public Records
Map
Nearby Homes
- 3120 Albret St
- 3050 W Kildare St
- 3052 Louise Ave
- 44856 Mariposa Dr
- 41705 30th St W
- 44620 Painted Desert St
- 3005 Minford St
- 2826 W Lingard St
- 2839 Minford St
- 2825 W Newgrove St
- 65 W Lancaster Blvd
- 8000 W Lancaster Blvd
- 50 W Lancaster Blvd
- 44927 Normandy Ln
- 44762 Shadowcrest Dr
- 0 S W Corner W Ave J & 32nd St W Unit 25004110
- 2556 W Lumber St
- 2824 Legends Way
- 3614 W Oldfield St
- 0 Caruso Ln
- 44825 Dusty Rd
- 44815 Dusty Rd
- 44816 Ruthron St
- 44816 Ruthron Ave
- 44822 Ruthron St
- 44831 Dusty Rd
- 44828 Ruthron St
- 44814 Ruthron St
- 44824 Dusty Rd
- 3114 Albret St
- 44836 Ruthron St
- 44839 Dusty Rd
- 44830 Dusty Rd
- 44812 Ruthron St
- 44838 Dusty Rd
- 3353 W Lancaster Blvd Unit L-4
- 2925 W Lancaster Blvd Unit J-4
- 3108 Albret St
- 44845 Dusty Rd
- 3103 Albret St