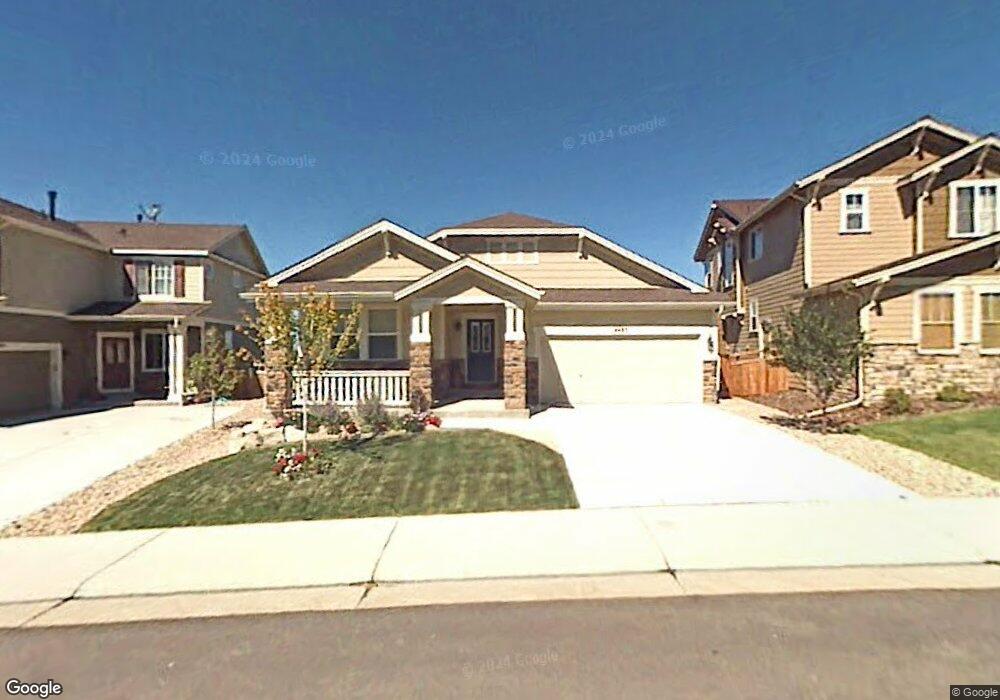
4483 Applecrest Cir Castle Rock, CO 80109
The Meadows NeighborhoodEstimated Value: $547,000 - $601,000
3
Beds
3
Baths
2,209
Sq Ft
$260/Sq Ft
Est. Value
About This Home
This home is located at 4483 Applecrest Cir, Castle Rock, CO 80109 and is currently estimated at $574,804, approximately $260 per square foot. 4483 Applecrest Cir is a home located in Douglas County with nearby schools including Soaring Hawk Elementary School, Castle Rock Middle School, and Castle View High School.
Ownership History
Date
Name
Owned For
Owner Type
Purchase Details
Closed on
Mar 7, 2016
Sold by
Beaudoin Nicholas J and Beaudoin Sarah M
Bought by
Lamb John W
Current Estimated Value
Purchase Details
Closed on
Jun 6, 2014
Sold by
Haaland Phyllis A and Haaland Carl J
Bought by
Beaudoin Nicholas J and Beaudoin Sarah M
Home Financials for this Owner
Home Financials are based on the most recent Mortgage that was taken out on this home.
Original Mortgage
$260,000
Interest Rate
3.37%
Mortgage Type
Adjustable Rate Mortgage/ARM
Purchase Details
Closed on
Mar 14, 2007
Sold by
Capital Pacific Holdings Llc
Bought by
Haaland Carl J and Haaland Phyllis A
Purchase Details
Closed on
Jun 17, 2004
Sold by
Capital Pacific Holdings Llc
Bought by
Lcp Meadows Llc
Purchase Details
Closed on
Jan 2, 2003
Sold by
Castle Rock Development Company
Bought by
Capital Pacific Holdings Llc
Create a Home Valuation Report for This Property
The Home Valuation Report is an in-depth analysis detailing your home's value as well as a comparison with similar homes in the area
Home Values in the Area
Average Home Value in this Area
Purchase History
| Date | Buyer | Sale Price | Title Company |
|---|---|---|---|
| Lamb John W | $355,000 | First Integrity Title | |
| Beaudoin Nicholas J | $325,000 | Land Title Guarantee Company | |
| Haaland Carl J | $274,410 | None Available | |
| Lcp Meadows Llc | $7,218,000 | -- | |
| Capital Pacific Holdings Llc | $4,410,000 | -- |
Source: Public Records
Mortgage History
| Date | Status | Borrower | Loan Amount |
|---|---|---|---|
| Previous Owner | Beaudoin Nicholas J | $260,000 |
Source: Public Records
Tax History Compared to Growth
Tax History
| Year | Tax Paid | Tax Assessment Tax Assessment Total Assessment is a certain percentage of the fair market value that is determined by local assessors to be the total taxable value of land and additions on the property. | Land | Improvement |
|---|---|---|---|---|
| 2024 | $4,033 | $42,360 | $8,860 | $33,500 |
| 2023 | $4,071 | $42,360 | $8,860 | $33,500 |
| 2022 | $3,123 | $30,730 | $6,550 | $24,180 |
| 2021 | $3,243 | $30,730 | $6,550 | $24,180 |
| 2020 | $2,958 | $28,690 | $5,940 | $22,750 |
| 2019 | $2,968 | $28,690 | $5,940 | $22,750 |
| 2018 | $2,677 | $25,440 | $4,600 | $20,840 |
| 2017 | $2,525 | $25,440 | $4,600 | $20,840 |
| 2016 | $2,323 | $23,000 | $4,470 | $18,530 |
| 2015 | $1,183 | $23,000 | $4,470 | $18,530 |
| 2014 | $2,050 | $18,810 | $3,940 | $14,870 |
Source: Public Records
Map
Nearby Homes
- 2872 Feather Ct
- 2934 Feather Ct
- 4408 Applecrest Cir
- 4351 Applecrest Cir
- 4433 Prairie Rose Cir
- 3048 Starling Ct
- 3266 Coyote Hills Way
- 4064 Scarlet Oak Ct
- 3348 Elk Run Dr
- 3355 Willowrun Dr
- 4245 Prairie Rose Cir
- 3438 Elk Run Dr
- 3443 Elk Run Dr
- 2310 Woodhouse Ln
- 4666 Heartwood Way
- 4298 Abstract St
- 2877 Craig Ct
- 2980 Craig Ct
- 2339 Robindale Way
- 3066 Craig Ct
- 4477 Applecrest Cir
- 4495 Applecrest Cir
- 4465 Applecrest Cir
- 4507 Applecrest Cir
- 4521 Applecrest Cir
- 4480 Applecrest Cir
- 4498 Applecrest Cir
- 2873 Feather Ct
- 4464 Applecrest Cir
- 2905 Feather Ct
- 4522 Applecrest Cir
- 4535 Applecrest Cir
- 4458 Applecrest Cir
- 4536 Applecrest Cir
- 4549 Applecrest Cir
- 4442 Applecrest Cir
- 2949 Feather Ct
- 4550 Applecrest Cir
- 4563 Applecrest Cir
- 4426 Applecrest Cir