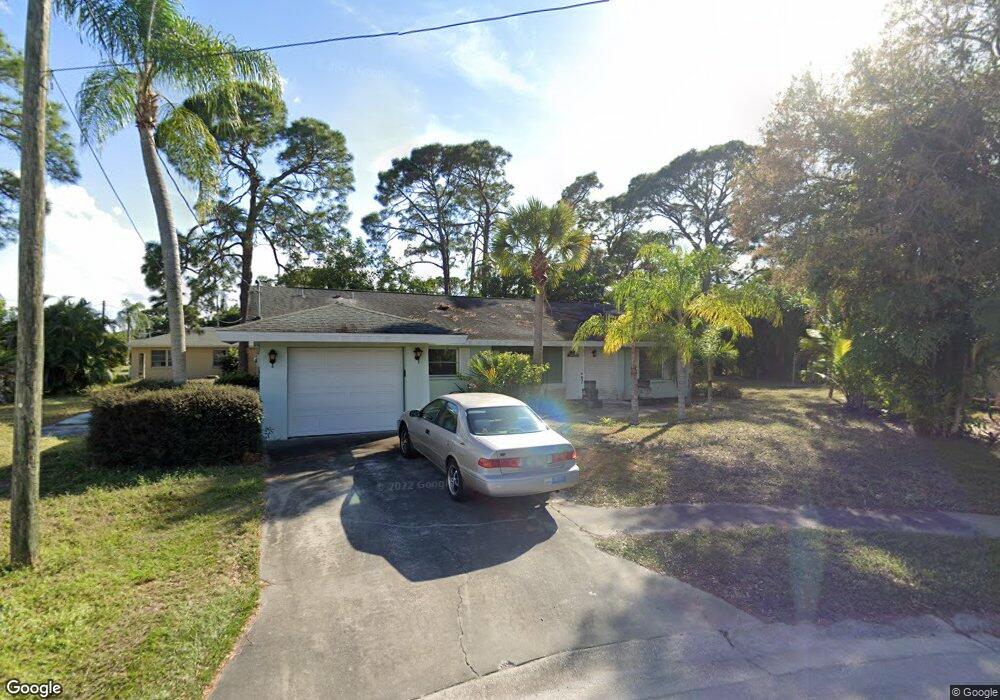
4484 Lanier Ct Unit 1 North Fort Myers, FL 33903
Hancock NeighborhoodEstimated Value: $239,000 - $275,000
3
Beds
2
Baths
1,774
Sq Ft
$145/Sq Ft
Est. Value
About This Home
This home is located at 4484 Lanier Ct Unit 1, North Fort Myers, FL 33903 and is currently estimated at $256,870, approximately $144 per square foot. 4484 Lanier Ct Unit 1 is a home located in Lee County with nearby schools including Tropic Isles Elementary School, Hancock Creek Elementary School, and Caloosa Elementary School.
Ownership History
Date
Name
Owned For
Owner Type
Purchase Details
Closed on
Aug 30, 2022
Sold by
Jvp Llc
Bought by
Mott Arthur F and Mott Caroline Ann
Current Estimated Value
Home Financials for this Owner
Home Financials are based on the most recent Mortgage that was taken out on this home.
Original Mortgage
$231,660
Outstanding Balance
$221,531
Interest Rate
5.54%
Mortgage Type
New Conventional
Estimated Equity
$35,339
Purchase Details
Closed on
Sep 21, 2017
Sold by
Petersen James V
Bought by
Jvp Llc
Purchase Details
Closed on
Sep 6, 2013
Sold by
Petersen James V and Petersen Shelley D
Bought by
Petersen James V
Purchase Details
Closed on
Jul 27, 2011
Sold by
Manning Russell and Manning Sharon
Bought by
Peterson James V
Purchase Details
Closed on
Apr 28, 2004
Sold by
Wolf Mary Louise
Bought by
Manning Russel and Manning Sharon
Home Financials for this Owner
Home Financials are based on the most recent Mortgage that was taken out on this home.
Original Mortgage
$106,400
Interest Rate
5.49%
Mortgage Type
Unknown
Create a Home Valuation Report for This Property
The Home Valuation Report is an in-depth analysis detailing your home's value as well as a comparison with similar homes in the area
Home Values in the Area
Average Home Value in this Area
Purchase History
| Date | Buyer | Sale Price | Title Company |
|---|---|---|---|
| Mott Arthur F | $257,400 | Superior Title | |
| Jvp Llc | -- | Attorney | |
| Petersen James V | -- | None Available | |
| Petersen James V | -- | None Available | |
| Peterson James V | $53,000 | First Priority Title Llc | |
| Manning Russel | -- | Southern States Abstract & T | |
| Manning Russel | $133,000 | Southern States Abstract & T |
Source: Public Records
Mortgage History
| Date | Status | Borrower | Loan Amount |
|---|---|---|---|
| Open | Mott Arthur F | $231,660 | |
| Previous Owner | Manning Russel | $106,400 |
Source: Public Records
Tax History Compared to Growth
Tax History
| Year | Tax Paid | Tax Assessment Tax Assessment Total Assessment is a certain percentage of the fair market value that is determined by local assessors to be the total taxable value of land and additions on the property. | Land | Improvement |
|---|---|---|---|---|
| 2025 | $2,508 | $177,833 | $71,060 | $105,625 |
| 2024 | $2,438 | $191,363 | $24,174 | $160,288 |
| 2023 | $2,438 | $185,789 | $40,612 | $140,968 |
| 2022 | $2,880 | $161,031 | $0 | $0 |
| 2021 | $2,490 | $146,392 | $17,075 | $129,317 |
| 2020 | $2,360 | $134,852 | $11,550 | $123,302 |
| 2019 | $2,225 | $125,975 | $13,650 | $112,325 |
| 2018 | $2,260 | $125,972 | $13,650 | $112,322 |
| 2017 | $1,903 | $111,431 | $12,600 | $98,831 |
| 2016 | $1,668 | $98,944 | $13,437 | $85,507 |
| 2015 | $1,527 | $84,805 | $11,459 | $73,346 |
| 2014 | $1,406 | $77,895 | $11,377 | $66,518 |
| 2013 | -- | $66,904 | $9,959 | $56,945 |
Source: Public Records
Map
Nearby Homes
- 118 SE 23rd Place
- 217 SE 24th Ave
- 5905 Untermeyer Ct
- 4380 Saint Clair Ave W
- 2309 SE 3rd St
- 2303 SE 3rd St
- 315 SE 24th Ave
- 2220 SE 2nd Terrace
- 4344 Saint Clair Ave W
- 4777 Orange Grove Blvd Unit 5
- 2105 SE 2nd Terrace
- 502 SE 24th Ave
- 2113 Lochmoor Cir Unit 4
- 508 SE 24th Ave
- 0 Happy Dale Rd Unit 2025008482
- 508 SE 23rd Place
- 4728 Orange Grove Blvd Unit 8
- 4728 Orange Grove Blvd Unit 3
- 888 Ridgeway Dr
- 118 NE 21st Ave
- 4490 Lanier Ct
- 4476 Lanier Ct
- 4477 Saint Clair Ave W
- 4487 Saint Clair Ave W
- 5938 Milne Cir
- 4493 Lanier Ct
- 4495 Saint Clair Ave W
- 4485 Lanier Ct
- 123 SE 24th Ave
- 119 SE 24th Ave
- 119 SE 24th Ave Unit A-B
- 123/125 SE 24th Ave
- 5941 Milne Cir
- 5947 Milne Cir
- 127 SE 24th Ave
- 4476 Saint Clair Ave W
- 4459 Saint Clair Ave W
- 4482 Saint Clair Ave W
- 5960 Milne Cir
- 4468 Saint Clair Ave W