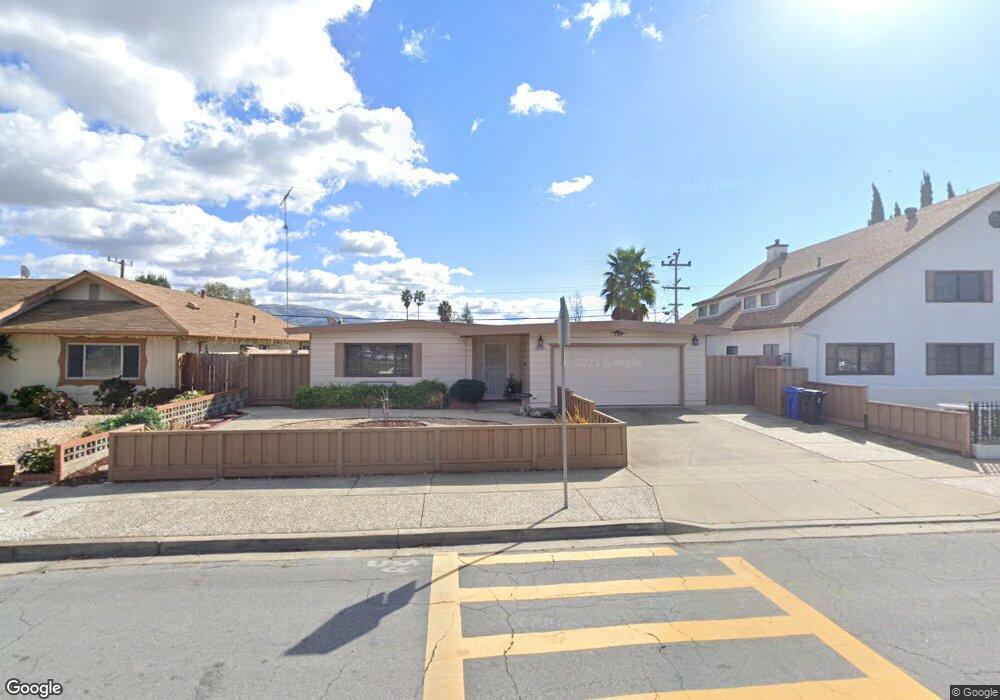
4484 Seneca Park Ave Fremont, CA 94538
Grimmer NeighborhoodEstimated Value: $1,401,000 - $1,551,000
3
Beds
2
Baths
1,198
Sq Ft
$1,210/Sq Ft
Est. Value
About This Home
This home is located at 4484 Seneca Park Ave, Fremont, CA 94538 and is currently estimated at $1,449,442, approximately $1,209 per square foot. 4484 Seneca Park Ave is a home located in Alameda County with nearby schools including Harvey Green Elementary School, John M. Horner Junior High School, and Irvington High School.
Ownership History
Date
Name
Owned For
Owner Type
Purchase Details
Closed on
Jul 26, 2017
Sold by
Sodha Bharati
Bought by
Sodha Bharati and The Bharati Sodha Living Trust
Current Estimated Value
Purchase Details
Closed on
Jul 9, 2002
Sold by
Perry Patty L
Bought by
Sodha Bharati
Home Financials for this Owner
Home Financials are based on the most recent Mortgage that was taken out on this home.
Original Mortgage
$284,000
Interest Rate
6.6%
Mortgage Type
Balloon
Create a Home Valuation Report for This Property
The Home Valuation Report is an in-depth analysis detailing your home's value as well as a comparison with similar homes in the area
Home Values in the Area
Average Home Value in this Area
Purchase History
| Date | Buyer | Sale Price | Title Company |
|---|---|---|---|
| Sodha Bharati | -- | None Available | |
| Sodha Bharati | $395,000 | Chicago Title Co |
Source: Public Records
Mortgage History
| Date | Status | Borrower | Loan Amount |
|---|---|---|---|
| Closed | Sodha Bharati | $284,000 |
Source: Public Records
Tax History Compared to Growth
Tax History
| Year | Tax Paid | Tax Assessment Tax Assessment Total Assessment is a certain percentage of the fair market value that is determined by local assessors to be the total taxable value of land and additions on the property. | Land | Improvement |
|---|---|---|---|---|
| 2025 | $7,100 | $565,038 | $171,611 | $400,427 |
| 2024 | $7,100 | $553,824 | $168,247 | $392,577 |
| 2023 | $6,902 | $549,831 | $164,949 | $384,882 |
| 2022 | $6,801 | $532,051 | $161,715 | $377,336 |
| 2021 | $6,637 | $521,485 | $158,545 | $369,940 |
| 2020 | $6,620 | $523,070 | $156,921 | $366,149 |
| 2019 | $6,546 | $512,815 | $153,844 | $358,971 |
| 2018 | $6,416 | $502,763 | $150,829 | $351,934 |
| 2017 | $6,255 | $492,908 | $147,872 | $345,036 |
| 2016 | $6,143 | $483,246 | $144,974 | $338,272 |
| 2015 | $6,055 | $475,990 | $142,797 | $333,193 |
| 2014 | $5,947 | $466,668 | $140,000 | $326,668 |
Source: Public Records
Map
Nearby Homes
- 42932 Peachwood St
- 4533 Capewood Terrace
- 4537 Capewood Terrace
- 4309 Bora Ave
- 4860 Bryce Canyon Park Dr
- 43163 Grimmer Terrace
- 41882 Gifford St
- 92 Delta Green
- 48 Eagle Green
- 5341 Audubon Park Ct
- 4751 Wadsworth Ct
- 3923 Wildflower Common Unit 19
- 40696 Robin St
- 262 Manitoba Green
- 42759 Newport Dr
- 3872 Wildflower Common Unit 27
- 202 Manitoba Terrace
- 208 Manitoba Terrace
- 261 Manitoba Green Unit 261
- 257 Manitoba Green
- 4472 Seneca Park Ave
- 4496 Seneca Park Ave
- 4473 Cherrywood Ave
- 4485 Cherrywood Ave
- 4460 Seneca Park Ave
- 4461 Cherrywood Ave
- 4497 Cherrywood Ave
- 4449 Cherrywood Ave
- 4507 Seneca Park Ave
- 4458 Fern Common
- 42519 Lemonwood St
- 4519 Seneca Park Ave
- 4437 Cherrywood Ave
- 4454 Fern Common
- 42537 Lemonwood St
- 42641 Applewood St
- 42624 Applewood St
- 4521 Seneca Park Ave
- 42622 Lemonwood St
- 4452 Fern Common