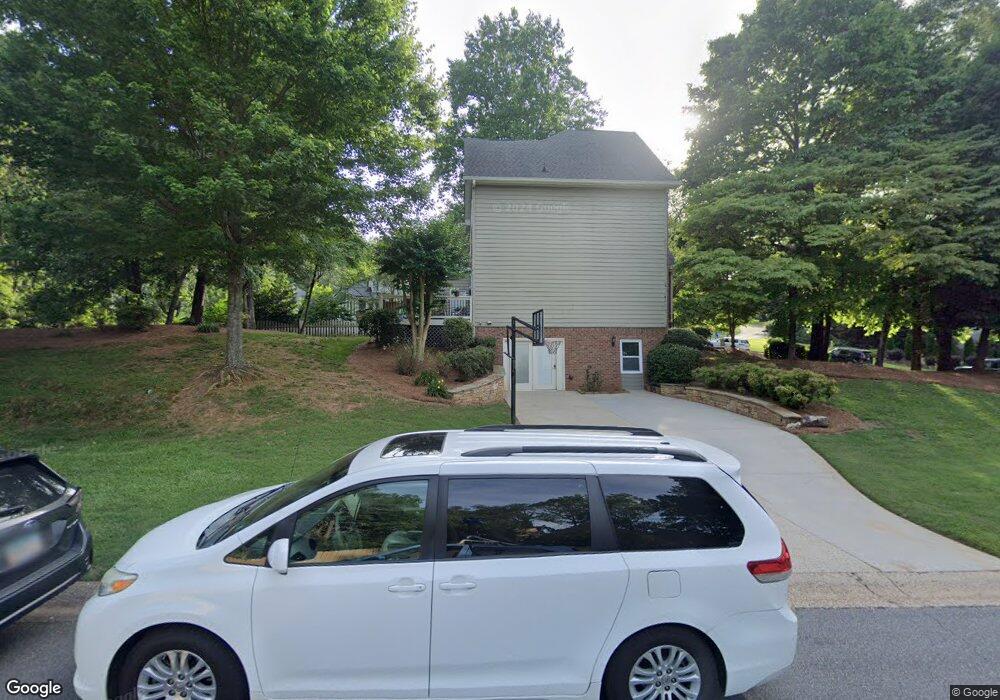
4484 Windsor Oaks Cir Unit 4 Marietta, GA 30066
Sandy Plains NeighborhoodEstimated Value: $775,000 - $922,000
4
Beds
5
Baths
3,222
Sq Ft
$260/Sq Ft
Est. Value
About This Home
This home is located at 4484 Windsor Oaks Cir Unit 4, Marietta, GA 30066 and is currently estimated at $837,193, approximately $259 per square foot. 4484 Windsor Oaks Cir Unit 4 is a home located in Cobb County with nearby schools including Davis Elementary School, Mabry Middle School, and Lassiter High School.
Ownership History
Date
Name
Owned For
Owner Type
Purchase Details
Closed on
May 28, 2015
Sold by
Swindell Stephen D
Bought by
Casey Adam D and Casey Ashley Grace
Current Estimated Value
Home Financials for this Owner
Home Financials are based on the most recent Mortgage that was taken out on this home.
Original Mortgage
$391,400
Outstanding Balance
$303,582
Interest Rate
3.79%
Mortgage Type
New Conventional
Estimated Equity
$533,611
Purchase Details
Closed on
Feb 28, 2005
Sold by
Wolfe Joseph E
Bought by
Swindell Stephen D and Swindell Lynda
Home Financials for this Owner
Home Financials are based on the most recent Mortgage that was taken out on this home.
Original Mortgage
$202,000
Interest Rate
5.6%
Mortgage Type
New Conventional
Create a Home Valuation Report for This Property
The Home Valuation Report is an in-depth analysis detailing your home's value as well as a comparison with similar homes in the area
Home Values in the Area
Average Home Value in this Area
Purchase History
| Date | Buyer | Sale Price | Title Company |
|---|---|---|---|
| Casey Adam D | $412,000 | -- | |
| Swindell Stephen D | $342,100 | -- |
Source: Public Records
Mortgage History
| Date | Status | Borrower | Loan Amount |
|---|---|---|---|
| Open | Casey Adam D | $391,400 | |
| Previous Owner | Swindell Stephen D | $202,000 |
Source: Public Records
Tax History Compared to Growth
Tax History
| Year | Tax Paid | Tax Assessment Tax Assessment Total Assessment is a certain percentage of the fair market value that is determined by local assessors to be the total taxable value of land and additions on the property. | Land | Improvement |
|---|---|---|---|---|
| 2025 | $7,238 | $285,508 | $64,000 | $221,508 |
| 2024 | $7,244 | $285,508 | $64,000 | $221,508 |
| 2023 | $6,163 | $260,728 | $50,000 | $210,728 |
| 2022 | $5,887 | $220,996 | $44,000 | $176,996 |
| 2021 | $5,265 | $192,616 | $40,800 | $151,816 |
| 2020 | $5,265 | $192,616 | $40,800 | $151,816 |
| 2019 | $4,822 | $172,344 | $38,000 | $134,344 |
| 2018 | $4,822 | $172,344 | $38,000 | $134,344 |
| 2017 | $4,590 | $172,344 | $38,000 | $134,344 |
| 2016 | $4,239 | $156,324 | $36,000 | $120,324 |
| 2015 | $4,077 | $156,324 | $36,000 | $120,324 |
| 2014 | $3,784 | $141,944 | $0 | $0 |
Source: Public Records
Map
Nearby Homes
- 3043 Sawyer Trace NE
- 2855 Lamer Trace
- 4563 Ashmore Cir NE
- 4397 Windsor Oaks Cir
- 4589 Wigley Estates Rd
- 2842 Forest Chase Dr NE
- 4464 Windsor Oaks Dr
- 3333 Devaughn Dr NE
- 2713 Arbor Summit
- 2958 Forest Chase Terrace NE
- 4259 Arbor Club Dr
- 4302 Highborne Dr NE Unit 3
- 4243 N Mountain Rd NE
- 4219 N Mountain Rd NE
- 2696 S Arbor Dr
- 3130 Maley Ct
- 3350 Brookhill Cir
- 2610 Chadwick Rd
- 2603 Chadwick Rd
- 3901 Hazelhurst Dr
- 4482 Windsor Oaks Cir
- 3020 Oaktree Landing NE Unit 10
- 4490 Windsor Oaks Cir
- 4480 Windsor Oaks Cir
- 4491 Windsor Oaks Cir
- 2999 Windsor Way
- 3021 Oaktree Landing NE
- 4493 Windsor Oaks Cir Unit 4
- 3022 Oaktree Landing NE
- 4487 Windsor Oaks Cir Unit 4
- 4478 Windsor Oaks Cir
- 3000 Oaktree Ct NE
- 4495 Windsor Oaks Cir
- 2997 Windsor Way
- 4485 Windsor Oaks Cir
- 3023 Oaktree Landing NE
- 3024 Oaktree Landing NE
- 4483 Windsor Oaks Cir
- 3002 Oaktree Ct NE
- 2995 Windsor Way