Estimated Value: $941,899 - $1,027,000
4
Beds
4
Baths
2,975
Sq Ft
$335/Sq Ft
Est. Value
About This Home
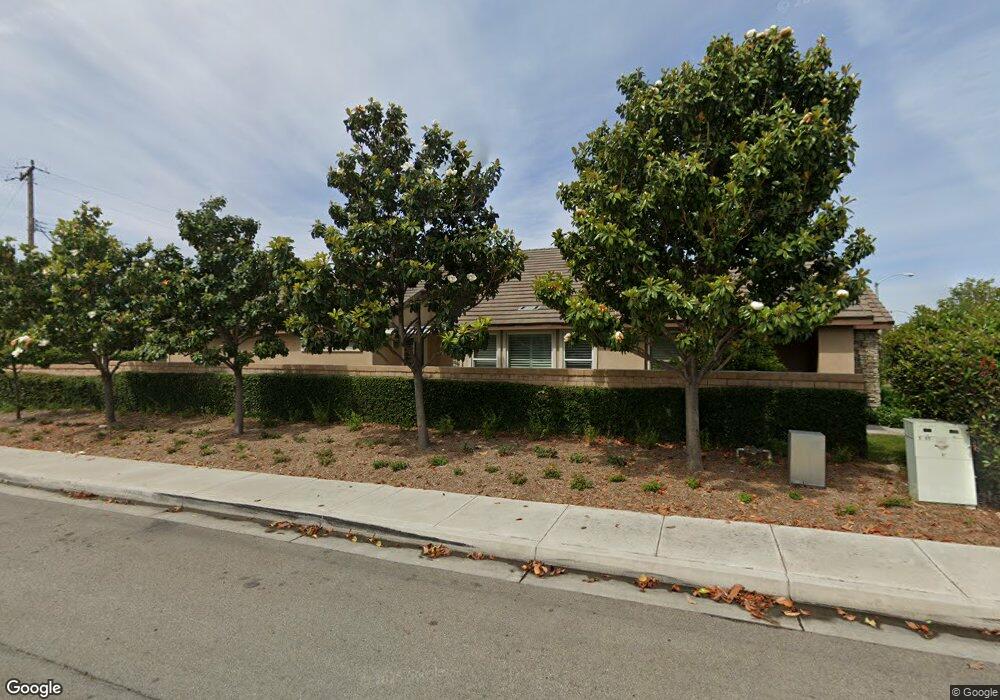
This home is located at 4487 Terry St, Chino, CA 91710 and is currently estimated at $996,475, approximately $334 per square foot. 4487 Terry St is a home located in San Bernardino County with nearby schools including Newman Elementary, Ramona Junior High School, and Don Antonio Lugo High School.
Ownership History
Date
Name
Owned For
Owner Type
Purchase Details
Closed on
Jul 28, 2018
Sold by
Hsu Jaw Ji and Hsu Mei Hua
Bought by
Hsu Jaw Ji and Hsu Mei Hua
Current Estimated Value
Purchase Details
Closed on
Aug 4, 2008
Sold by
Novastar Mortgage Inc
Bought by
Hsu Jaw Ji and Hsu Mei Hua
Home Financials for this Owner
Home Financials are based on the most recent Mortgage that was taken out on this home.
Original Mortgage
$349,000
Interest Rate
6.37%
Mortgage Type
Purchase Money Mortgage
Purchase Details
Closed on
Mar 14, 2008
Sold by
Roldan Claudia
Bought by
Novastar Mortgage Inc
Purchase Details
Closed on
Sep 1, 2006
Sold by
Aga Properties
Bought by
Roldan Claudia
Home Financials for this Owner
Home Financials are based on the most recent Mortgage that was taken out on this home.
Original Mortgage
$580,000
Interest Rate
8.23%
Mortgage Type
Purchase Money Mortgage
Create a Home Valuation Report for This Property
The Home Valuation Report is an in-depth analysis detailing your home's value as well as a comparison with similar homes in the area
Home Values in the Area
Average Home Value in this Area
Purchase History
| Date | Buyer | Sale Price | Title Company |
|---|---|---|---|
| Hsu Jaw Ji | -- | None Available | |
| Hsu Jaw Ji | $436,500 | Fidelity National Title | |
| Novastar Mortgage Inc | $499,644 | United Title Co | |
| Roldan Claudia | $725,000 | First American |
Source: Public Records
Mortgage History
| Date | Status | Borrower | Loan Amount |
|---|---|---|---|
| Closed | Hsu Jaw Ji | $349,000 | |
| Previous Owner | Roldan Claudia | $580,000 |
Source: Public Records
Tax History
| Year | Tax Paid | Tax Assessment Tax Assessment Total Assessment is a certain percentage of the fair market value that is determined by local assessors to be the total taxable value of land and additions on the property. | Land | Improvement |
|---|---|---|---|---|
| 2025 | $6,559 | $573,354 | $200,970 | $372,384 |
| 2024 | $6,384 | $562,111 | $197,029 | $365,082 |
| 2023 | $6,207 | $551,090 | $193,166 | $357,924 |
| 2022 | $6,160 | $540,284 | $189,378 | $350,906 |
| 2021 | $6,032 | $529,690 | $185,665 | $344,025 |
| 2020 | $5,952 | $524,258 | $183,761 | $340,497 |
| 2019 | $5,847 | $513,979 | $180,158 | $333,821 |
| 2018 | $5,717 | $503,900 | $176,625 | $327,275 |
| 2017 | $5,616 | $494,020 | $173,162 | $320,858 |
| 2016 | $5,253 | $484,334 | $169,767 | $314,567 |
| 2015 | $5,146 | $477,059 | $167,217 | $309,842 |
| 2014 | $5,046 | $467,714 | $163,941 | $303,773 |
Source: Public Records
Map
Nearby Homes
- 12608 Ramona Ave
- 12620 Anthony Place
- 12629 Thomas Place
- 12585 Yorba Ave
- 12488 Monte Vista Ave
- 12582 Monte Vista Ave
- 4043 Olive St
- 11938 Vista Ave
- 12958 Boston Ave
- 11814 Ramona Ave
- 11818 Yorba Ave
- 12124 Lester Ct
- 4965 Independence St
- 3809 Kern Rd
- 5056 Washington Ave
- 4440 Carmen St
- 4497 Carmen St
- 5195 Walnut Ave Unit 14
- 11795 Crystal Ave
- 3709 Kern Rd
- 4481 Terry St
- 4467 Terry St
- 12446 Ramona Ave
- 4480 Victoria St
- 12397 Tioga Ct
- 4470 Victoria St
- 4457 Terry St
- 12419 Ramona Ave
- 12405 Ramona Ave
- 12427 Ramona Ave
- 12395 Ramona Ave
- 4460 Victoria St
- 12387 Tioga Ct
- 12396 Tioga Ct
- 12387 Ramona Ave
- 12447 Ramona Ave
- 4450 Victoria St
- 12377 Tioga Ct
- 12386 Tioga Ct
- 12414 Loraine Ave