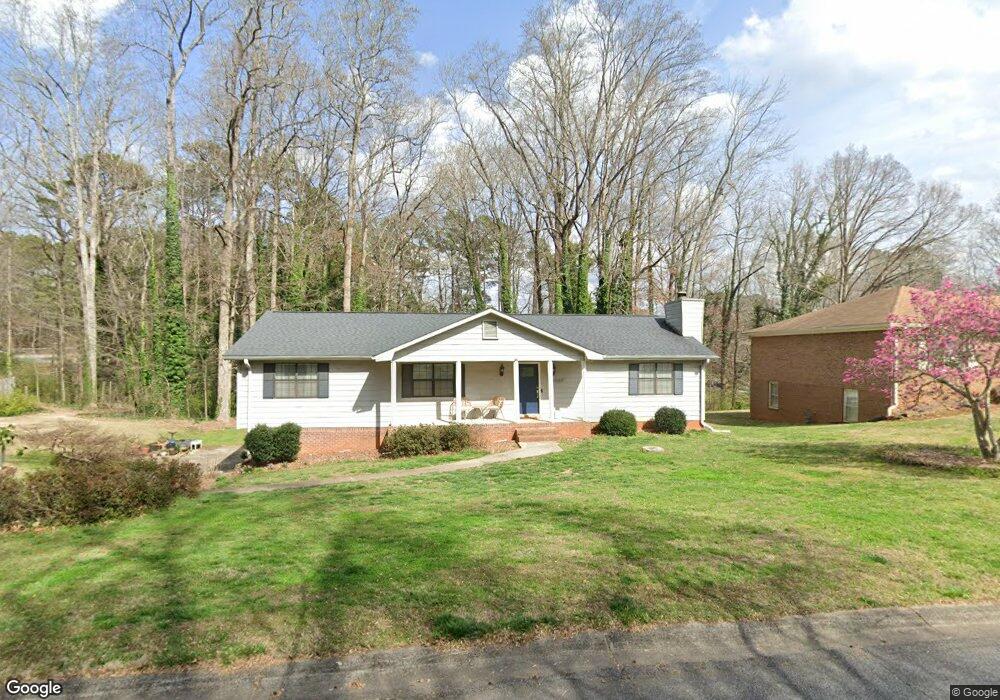
4489 Gann Crossing SW Smyrna, GA 30082
Estimated Value: $381,459 - $417,000
3
Beds
2
Baths
1,753
Sq Ft
$228/Sq Ft
Est. Value
About This Home
This home is located at 4489 Gann Crossing SW, Smyrna, GA 30082 and is currently estimated at $400,365, approximately $228 per square foot. 4489 Gann Crossing SW is a home located in Cobb County with nearby schools including Russell Elementary School, Floyd Middle School, and South Cobb High School.
Ownership History
Date
Name
Owned For
Owner Type
Purchase Details
Closed on
May 14, 2008
Sold by
Humphrey Jillian K
Bought by
Whalen Nathaniel J and Whalen Sharon E
Current Estimated Value
Home Financials for this Owner
Home Financials are based on the most recent Mortgage that was taken out on this home.
Original Mortgage
$201,832
Outstanding Balance
$127,117
Interest Rate
5.86%
Mortgage Type
FHA
Estimated Equity
$273,248
Purchase Details
Closed on
Feb 28, 2002
Sold by
Ward Pard R and Ward Maxine D
Bought by
Humphrey Jillan K
Home Financials for this Owner
Home Financials are based on the most recent Mortgage that was taken out on this home.
Original Mortgage
$143,900
Interest Rate
6.95%
Mortgage Type
New Conventional
Create a Home Valuation Report for This Property
The Home Valuation Report is an in-depth analysis detailing your home's value as well as a comparison with similar homes in the area
Home Values in the Area
Average Home Value in this Area
Purchase History
| Date | Buyer | Sale Price | Title Company |
|---|---|---|---|
| Whalen Nathaniel J | $205,000 | -- | |
| Humphrey Jillan K | $179,900 | -- |
Source: Public Records
Mortgage History
| Date | Status | Borrower | Loan Amount |
|---|---|---|---|
| Open | Whalen Nathaniel J | $201,832 | |
| Previous Owner | Humphrey Jillan K | $143,900 |
Source: Public Records
Tax History Compared to Growth
Tax History
| Year | Tax Paid | Tax Assessment Tax Assessment Total Assessment is a certain percentage of the fair market value that is determined by local assessors to be the total taxable value of land and additions on the property. | Land | Improvement |
|---|---|---|---|---|
| 2025 | $3,692 | $152,208 | $34,000 | $118,208 |
| 2024 | $3,158 | $127,436 | $30,000 | $97,436 |
| 2023 | $2,615 | $127,436 | $30,000 | $97,436 |
| 2022 | $2,846 | $112,120 | $30,000 | $82,120 |
| 2021 | $2,453 | $94,172 | $30,000 | $64,172 |
| 2020 | $2,453 | $94,172 | $30,000 | $64,172 |
| 2019 | $2,365 | $90,156 | $22,000 | $68,156 |
| 2018 | $2,267 | $85,656 | $19,200 | $66,456 |
| 2017 | $2,159 | $85,656 | $19,200 | $66,456 |
| 2016 | $2,186 | $86,800 | $19,200 | $67,600 |
| 2015 | $2,239 | $86,800 | $19,200 | $67,600 |
| 2014 | $1,802 | $69,472 | $0 | $0 |
Source: Public Records
Map
Nearby Homes
- 45 Concord Rd SW
- 450 Dorset Way SW
- 639 Concord Rd SW
- 4800 Timberland Dr SW
- 4766 Mckee Ct SW
- 620 Gregory Manor Dr SW
- 681 Manor Ridge Dr SW
- 4812 Lismoor Trace SW
- 4806 Lismoor Trace SW
- 4370 Conwhey Ct SW
- 512 Twilley Ridge Rd SW
- 4925 Olaughlin Ct SW
- 4672 Vernon Dr SW
- 647 Shannon Green Cir SW
- 680 Sundial Ln
- 684 Sundial Ln
- 4066 Covered Bridge Rd SW
- 4589 Moray Dr
- 4561 Moray Dr
- 4593 Moray Dr
- 4499 Gann Crossing SW
- 4475 Gann Crossing SW
- 4511 Gann Crossing SW
- 4504 Gann Crossing SW
- 4504 Gann Crossing SW
- 4508 Windsor Dr SW
- 496 Sheritan Way SW
- 451 Concord Rd SW
- 4523 Gann Crossing SW
- 4465 Windsor Dr SW
- 508 Sheritan Way SW Unit 24
- 508 Sheritan Way SW
- 4518 Windsor Dr SW
- 4537 Gann Crossing SW
- 487 Sheritan Way SW
- 483 Concord Rd SW
- 497 Sheritan Way SW
- 518 Sheritan Way SW
- 4495 Windsor Dr SW
- 4536 Windsor Dr SW