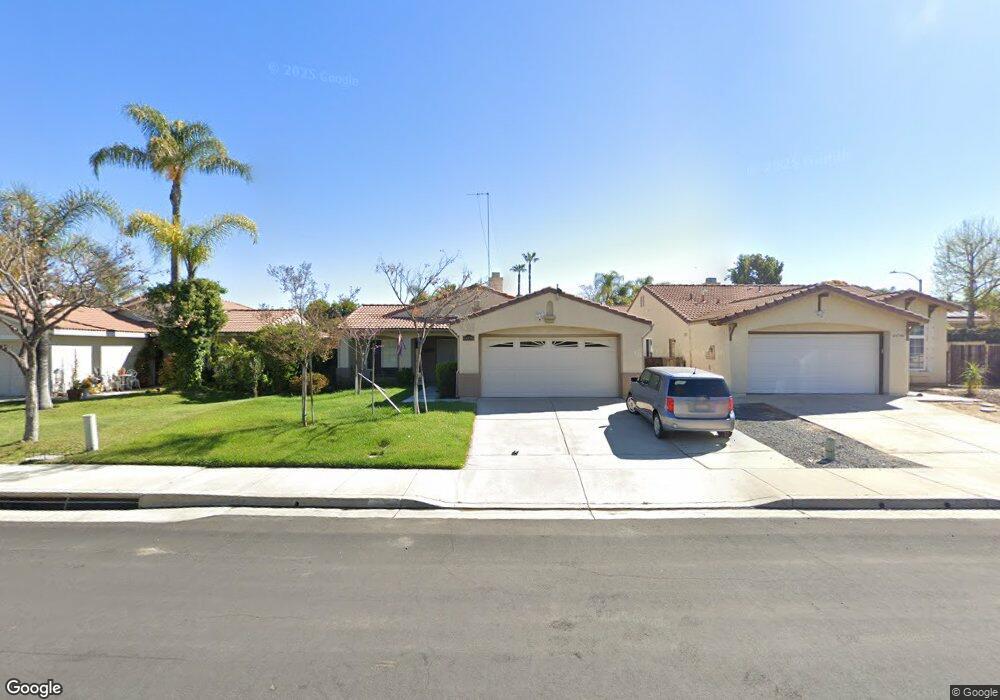
44896 Linalou Ranch Rd Temecula, CA 92592
Vail Ranch NeighborhoodEstimated Value: $587,421 - $621,000
4
Beds
2
Baths
1,234
Sq Ft
$491/Sq Ft
Est. Value
About This Home
This home is located at 44896 Linalou Ranch Rd, Temecula, CA 92592 and is currently estimated at $605,605, approximately $490 per square foot. 44896 Linalou Ranch Rd is a home located in Riverside County with nearby schools including Pauba Valley Elementary School, Vail Ranch Middle School, and Great Oak High School.
Ownership History
Date
Name
Owned For
Owner Type
Purchase Details
Closed on
Oct 31, 1996
Sold by
Fallis Shannon M and Fallis Angela M
Bought by
Kuhl Thomas A and Kuhl Peggy J
Current Estimated Value
Home Financials for this Owner
Home Financials are based on the most recent Mortgage that was taken out on this home.
Original Mortgage
$90,669
Outstanding Balance
$8,951
Interest Rate
8.11%
Mortgage Type
VA
Estimated Equity
$596,654
Purchase Details
Closed on
Nov 30, 1993
Sold by
Kaufman & Broad Of San Diego Inc
Bought by
Fallis Shannon M and Fallis Angela M
Home Financials for this Owner
Home Financials are based on the most recent Mortgage that was taken out on this home.
Original Mortgage
$115,617
Interest Rate
6.85%
Mortgage Type
FHA
Create a Home Valuation Report for This Property
The Home Valuation Report is an in-depth analysis detailing your home's value as well as a comparison with similar homes in the area
Home Values in the Area
Average Home Value in this Area
Purchase History
| Date | Buyer | Sale Price | Title Company |
|---|---|---|---|
| Kuhl Thomas A | $99,500 | Old Republic Title Company | |
| Fallis Shannon M | $116,000 | First American Title Insuran |
Source: Public Records
Mortgage History
| Date | Status | Borrower | Loan Amount |
|---|---|---|---|
| Open | Kuhl Thomas A | $90,669 | |
| Previous Owner | Fallis Shannon M | $115,617 |
Source: Public Records
Tax History
| Year | Tax Paid | Tax Assessment Tax Assessment Total Assessment is a certain percentage of the fair market value that is determined by local assessors to be the total taxable value of land and additions on the property. | Land | Improvement |
|---|---|---|---|---|
| 2025 | $753 | $164,652 | $48,839 | $115,813 |
| 2023 | $753 | $158,261 | $46,944 | $111,317 |
| 2022 | $774 | $155,159 | $46,024 | $109,135 |
| 2021 | $2,211 | $152,118 | $45,122 | $106,996 |
| 2020 | $2,178 | $150,559 | $44,660 | $105,899 |
| 2019 | $2,152 | $147,608 | $43,785 | $103,823 |
| 2018 | $2,107 | $144,715 | $42,928 | $101,787 |
| 2017 | $2,068 | $141,879 | $42,087 | $99,792 |
| 2016 | $2,032 | $139,098 | $41,262 | $97,836 |
| 2015 | $1,995 | $137,011 | $40,644 | $96,367 |
| 2014 | $1,935 | $134,329 | $39,849 | $94,480 |
Source: Public Records
Map
Nearby Homes
- 32423 Enriqueta Cir
- 32453 Enriqueta Cir
- 32509 Hupa Dr
- 45433 Vista Verde
- 45062 Corte Bella Donna
- 32661 Clearvail Dr
- 32666 Clearvail Dr
- 32848 Freesia Way
- 45190 Saint Tisbury St
- 32038 Corte Eldorado
- 32965 Sotelo Dr
- 32984 Sotelo Dr
- 32119 Corte Bonilio
- 45316 Saint Tisbury St
- 32847 Saskia Pass
- 45211 Tioga St
- 32153 Caminito Osuna
- 32815 Cleveland St
- 45540 Via Jaca
- 33097 Corte Ganso
- 44888 Linalou Ranch Rd
- 32462 Cervin Cir
- 44880 Linalou Ranch Rd
- 32435 Akes Pass
- 32472 Cervin Cir
- 32445 Akes Pass
- 44920 Linalou Ranch Rd
- 32465 Akes Pass
- 32482 Cervin Cir
- 32467 Cervin Cir
- 44928 Linalou Ranch Rd
- 44864 Linalou Ranch Rd
- 32477 Cervin Cir
- 32475 Akes Pass
- 32492 Cervin Cir
- 32440 Akes Pass
- 44936 Linalou Ranch Rd
- 32487 Cervin Cir
- 44856 Linalou Ranch Rd
- 32460 Akes Pass
Your Personal Tour Guide
Ask me questions while you tour the home.