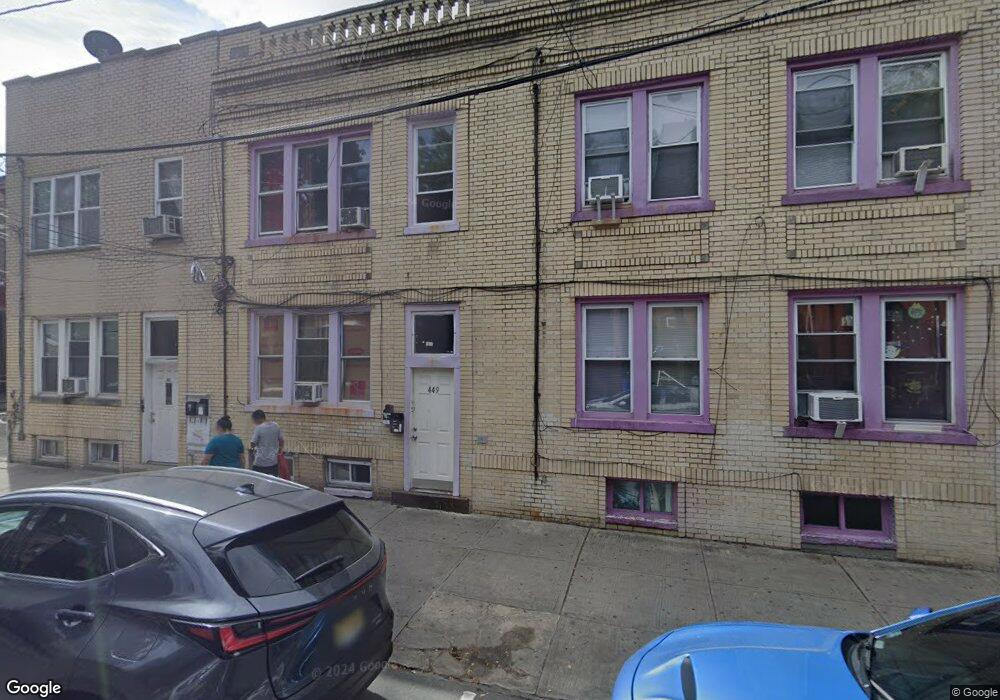
449 65th St Unit 1 West New York, NJ 07093
Estimated Value: $413,000 - $748,000
3
Beds
1
Bath
900
Sq Ft
$659/Sq Ft
Est. Value
About This Home
This home is located at 449 65th St Unit 1, West New York, NJ 07093 and is currently estimated at $592,926, approximately $658 per square foot. 449 65th St Unit 1 is a home located in Hudson County with nearby schools including Memorial High School and St. Joseph of the Palisades Elementary School.
Ownership History
Date
Name
Owned For
Owner Type
Purchase Details
Closed on
Nov 2, 2018
Sold by
Betancourt Jose and Betancourt Yvonne
Bought by
126 Ripley Llc
Current Estimated Value
Purchase Details
Closed on
Mar 4, 2016
Sold by
Fannie Mae
Bought by
Betancourt Jose
Purchase Details
Closed on
Apr 9, 2015
Sold by
Becker Pluese
Bought by
Federal National Mortgage Association
Purchase Details
Closed on
Jun 13, 2008
Sold by
Disla Awilda
Bought by
Rosario Jose A and Disla Awilda
Purchase Details
Closed on
Jul 12, 2005
Sold by
Rosario Jose A
Bought by
Disla Awilda
Home Financials for this Owner
Home Financials are based on the most recent Mortgage that was taken out on this home.
Original Mortgage
$319,200
Interest Rate
7.6%
Mortgage Type
Adjustable Rate Mortgage/ARM
Purchase Details
Closed on
May 31, 2002
Sold by
Hernandez Carlos
Bought by
Rosario Jose A
Home Financials for this Owner
Home Financials are based on the most recent Mortgage that was taken out on this home.
Original Mortgage
$166,250
Interest Rate
6.79%
Mortgage Type
Purchase Money Mortgage
Create a Home Valuation Report for This Property
The Home Valuation Report is an in-depth analysis detailing your home's value as well as a comparison with similar homes in the area
Home Values in the Area
Average Home Value in this Area
Purchase History
| Date | Buyer | Sale Price | Title Company |
|---|---|---|---|
| 126 Ripley Llc | $263,000 | Westcor Land Title Ins Co | |
| Betancourt Jose | -- | None Available | |
| Federal National Mortgage Association | $150,000 | None Available | |
| Rosario Jose A | -- | None Available | |
| Disla Awilda | $399,000 | -- | |
| Rosario Jose A | $175,000 | Chicago Title Insurance Co |
Source: Public Records
Mortgage History
| Date | Status | Borrower | Loan Amount |
|---|---|---|---|
| Previous Owner | Disla Awilda | $319,200 | |
| Previous Owner | Rosario Jose A | $166,250 |
Source: Public Records
Tax History Compared to Growth
Tax History
| Year | Tax Paid | Tax Assessment Tax Assessment Total Assessment is a certain percentage of the fair market value that is determined by local assessors to be the total taxable value of land and additions on the property. | Land | Improvement |
|---|---|---|---|---|
| 2025 | $8,110 | $98,200 | $35,600 | $62,600 |
| 2024 | $7,792 | $98,200 | $35,600 | $62,600 |
| 2023 | $7,792 | $98,200 | $35,600 | $62,600 |
| 2022 | $7,622 | $98,200 | $35,600 | $62,600 |
| 2021 | $7,551 | $98,200 | $35,600 | $62,600 |
| 2020 | $7,498 | $98,200 | $35,600 | $62,600 |
| 2019 | $7,426 | $98,200 | $35,600 | $62,600 |
| 2018 | $7,392 | $98,200 | $35,600 | $62,600 |
| 2017 | $7,359 | $98,200 | $35,600 | $62,600 |
| 2016 | $7,169 | $98,200 | $35,600 | $62,600 |
| 2015 | $7,031 | $98,200 | $35,600 | $62,600 |
| 2014 | $6,572 | $98,200 | $35,600 | $62,600 |
Source: Public Records
Map
Nearby Homes
- 532 64th St
- 530 64th St
- 6314 Bway143-64th St Unit 4
- 6208 Jackson St Unit 2
- 420 68th St
- 6715 Polk St Unit 12
- 6708 Jackson St Unit 2
- 322 67th St
- 6511 Hudson Ave
- 542 61st St
- 6031 Tyler Place
- 6118 Monroe Place
- 6211 Adams St
- 6600 John F. Kennedy Blvd Unit 23J
- 6600 Jfk Blvd E Unit 11A
- 6600 Jfk Blvd E Unit 23-J
- 6600 Boulevard E Unit 23C-PH
- 6600 Jfk Blvd E Unit 22B
- 6600 Jfk Blvd E Unit 4H
- 6600 Boulevard E Unit 11E
- 449 65th St
- 447 65th St
- 451 65th St
- 445 65th St
- 443 65th St
- 6408 Bergenline Ave Unit 2f
- 6408 Bergenline Ave Unit 2nd Rear
- 441 65th St
- 439 65th St
- 6406 Bergenline Ave Unit G
- 6406 Bergenline Ave
- 6406 Bergenline Ave Unit Ground Fl
- 6406 Bergenline Ave Unit 2nd
- 444 65th St
- 444 64th St
- 442 65th St
- 442 64th St
- 437 65th St
- 6404 Bergenline Ave
- 440 65th St