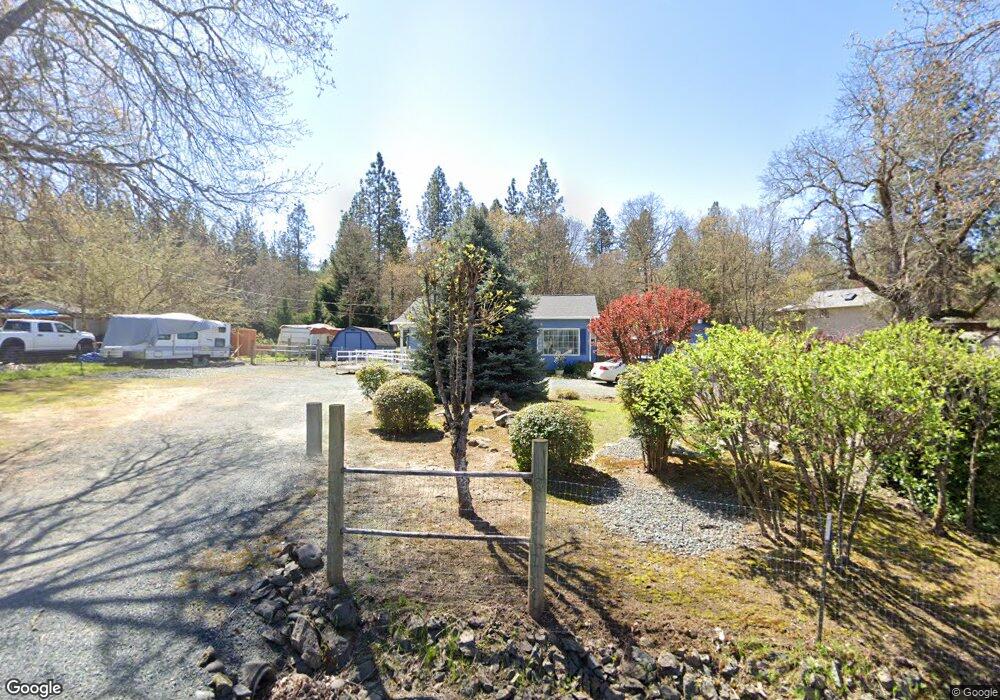
449 Acorn St Merlin, OR 97532
Merlin NeighborhoodEstimated Value: $281,000 - $296,956
2
Beds
2
Baths
884
Sq Ft
$327/Sq Ft
Est. Value
About This Home
This home is located at 449 Acorn St, Merlin, OR 97532 and is currently estimated at $288,978, approximately $326 per square foot. 449 Acorn St is a home located in Josephine County with nearby schools including Manzanita Elementary School, Fleming Middle School, and North Valley High School.
Ownership History
Date
Name
Owned For
Owner Type
Purchase Details
Closed on
Nov 22, 2010
Sold by
Federal National Mortgage Association
Bought by
Wadner Carol L
Current Estimated Value
Home Financials for this Owner
Home Financials are based on the most recent Mortgage that was taken out on this home.
Original Mortgage
$95,000
Outstanding Balance
$62,113
Interest Rate
4.17%
Mortgage Type
VA
Estimated Equity
$226,865
Purchase Details
Closed on
Sep 24, 2010
Sold by
Pennymac Loan Services Llc
Bought by
Federal National Mortgage Association
Home Financials for this Owner
Home Financials are based on the most recent Mortgage that was taken out on this home.
Original Mortgage
$95,000
Outstanding Balance
$62,113
Interest Rate
4.17%
Mortgage Type
VA
Estimated Equity
$226,865
Purchase Details
Closed on
Aug 25, 2010
Sold by
Grage Donald L and Grage Brenda L
Bought by
Pennymac Loan Services Llc
Create a Home Valuation Report for This Property
The Home Valuation Report is an in-depth analysis detailing your home's value as well as a comparison with similar homes in the area
Home Values in the Area
Average Home Value in this Area
Purchase History
| Date | Buyer | Sale Price | Title Company |
|---|---|---|---|
| Wadner Carol L | $130,000 | Ticor Title Company Oregon | |
| Federal National Mortgage Association | -- | Accommodation | |
| Pennymac Loan Services Llc | $167,967 | Accommodation |
Source: Public Records
Mortgage History
| Date | Status | Borrower | Loan Amount |
|---|---|---|---|
| Open | Wadner Carol L | $95,000 |
Source: Public Records
Tax History Compared to Growth
Tax History
| Year | Tax Paid | Tax Assessment Tax Assessment Total Assessment is a certain percentage of the fair market value that is determined by local assessors to be the total taxable value of land and additions on the property. | Land | Improvement |
|---|---|---|---|---|
| 2025 | $872 | $114,380 | -- | -- |
| 2024 | $872 | $111,050 | -- | -- |
| 2023 | $720 | $107,830 | $0 | $0 |
| 2022 | $728 | $104,690 | -- | -- |
| 2021 | $683 | $101,640 | $0 | $0 |
| 2020 | $647 | $98,690 | $0 | $0 |
| 2019 | $620 | $95,820 | $0 | $0 |
| 2018 | $628 | $93,030 | $0 | $0 |
| 2017 | $628 | $90,330 | $0 | $0 |
| 2016 | $529 | $87,710 | $0 | $0 |
| 2015 | $510 | $85,160 | $0 | $0 |
| 2014 | $497 | $82,680 | $0 | $0 |
Source: Public Records
Map
Nearby Homes
- 231 Acorn St
- 171 Almond St
- 221 Acorn St
- 0 Acorn St Unit Lot 1
- 0 Acorn St Unit Lot 3
- 0 Acorn St Unit Lot2
- 130 Acorn St
- 185 Peach St
- 0 Merln Sanitarium Rd Unit Lot 24
- 0 Merln Sanitarium Rd Unit Lot 13
- 559 Pleasantville Way
- 298 Tavis Dr
- 0 Merlin Sanitarium Rd Unit Lot 7
- 0 Merlin Sanitarium Rd Unit Lot 18
- 0 Merlin Sanitarium Rd Unit Lot 8
- 0 Merlin Sanitarium Rd Unit Lot 26
- 0 Merlin Sanitarium Rd Unit Lot 14
- 0 Merlin Sanitarium Rd Unit Lot 9
- 0 Merlin Sanitarium Rd Unit Lot 19
- 0 Merlin Sanitarium Rd Unit Lot 4