449 Silver Ave Southampton, PA 18966
Estimated Value: $473,000 - $670,000
4
Beds
2
Baths
2,297
Sq Ft
$247/Sq Ft
Est. Value
About This Home
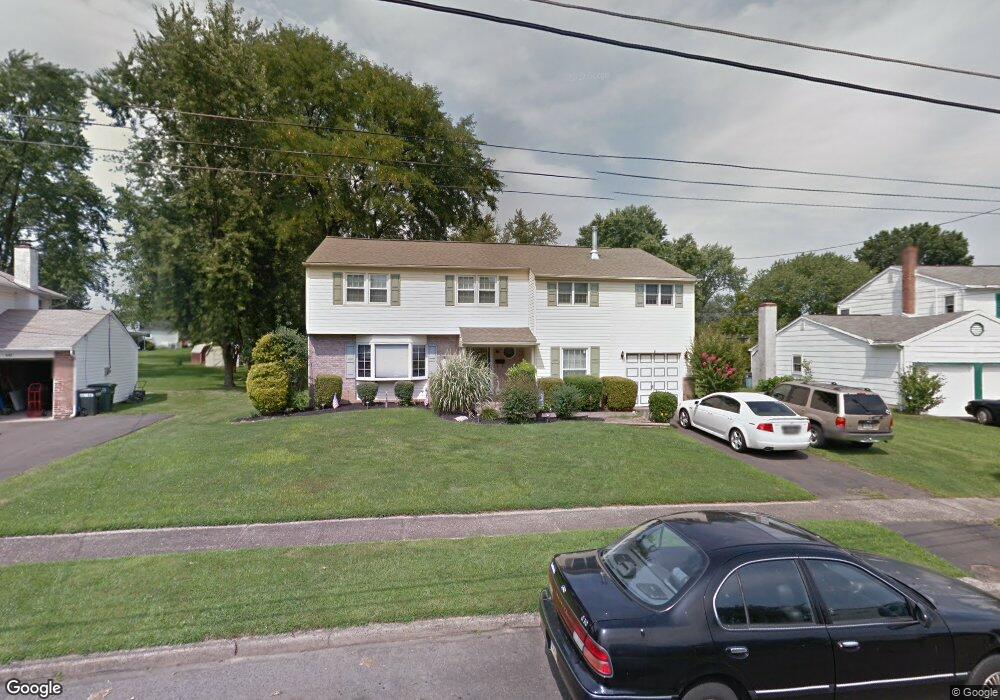
This home is located at 449 Silver Ave, Southampton, PA 18966 and is currently estimated at $568,497, approximately $247 per square foot. 449 Silver Ave is a home located in Bucks County with nearby schools including Davis Elementary School, Klinger Middle School, and William Tennent High School.
Ownership History
Date
Name
Owned For
Owner Type
Purchase Details
Closed on
Oct 14, 1994
Sold by
Sullivan Cynthia A
Bought by
Ligambi Joseph and Ligambi Anna
Current Estimated Value
Home Financials for this Owner
Home Financials are based on the most recent Mortgage that was taken out on this home.
Original Mortgage
$121,600
Interest Rate
8.49%
Purchase Details
Closed on
Aug 6, 1984
Bought by
Sullivan Michael T and Sullivan Cynthia A
Create a Home Valuation Report for This Property
The Home Valuation Report is an in-depth analysis detailing your home's value as well as a comparison with similar homes in the area
Home Values in the Area
Average Home Value in this Area
Purchase History
| Date | Buyer | Sale Price | Title Company |
|---|---|---|---|
| Ligambi Joseph | $152,000 | -- | |
| Sullivan Michael T | $85,000 | -- |
Source: Public Records
Mortgage History
| Date | Status | Borrower | Loan Amount |
|---|---|---|---|
| Closed | Ligambi Joseph | $121,600 |
Source: Public Records
Tax History Compared to Growth
Tax History
| Year | Tax Paid | Tax Assessment Tax Assessment Total Assessment is a certain percentage of the fair market value that is determined by local assessors to be the total taxable value of land and additions on the property. | Land | Improvement |
|---|---|---|---|---|
| 2025 | $6,374 | $29,800 | $6,040 | $23,760 |
| 2024 | $6,374 | $29,800 | $6,040 | $23,760 |
| 2023 | $6,180 | $29,800 | $6,040 | $23,760 |
| 2022 | $6,050 | $29,800 | $6,040 | $23,760 |
| 2021 | $5,941 | $29,800 | $6,040 | $23,760 |
| 2020 | $5,859 | $29,800 | $6,040 | $23,760 |
| 2019 | $5,643 | $29,800 | $6,040 | $23,760 |
| 2018 | $5,513 | $29,800 | $6,040 | $23,760 |
| 2017 | $5,357 | $29,800 | $6,040 | $23,760 |
| 2016 | $5,357 | $29,800 | $6,040 | $23,760 |
| 2015 | -- | $29,800 | $6,040 | $23,760 |
| 2014 | -- | $29,800 | $6,040 | $23,760 |
Source: Public Records
Map
Nearby Homes