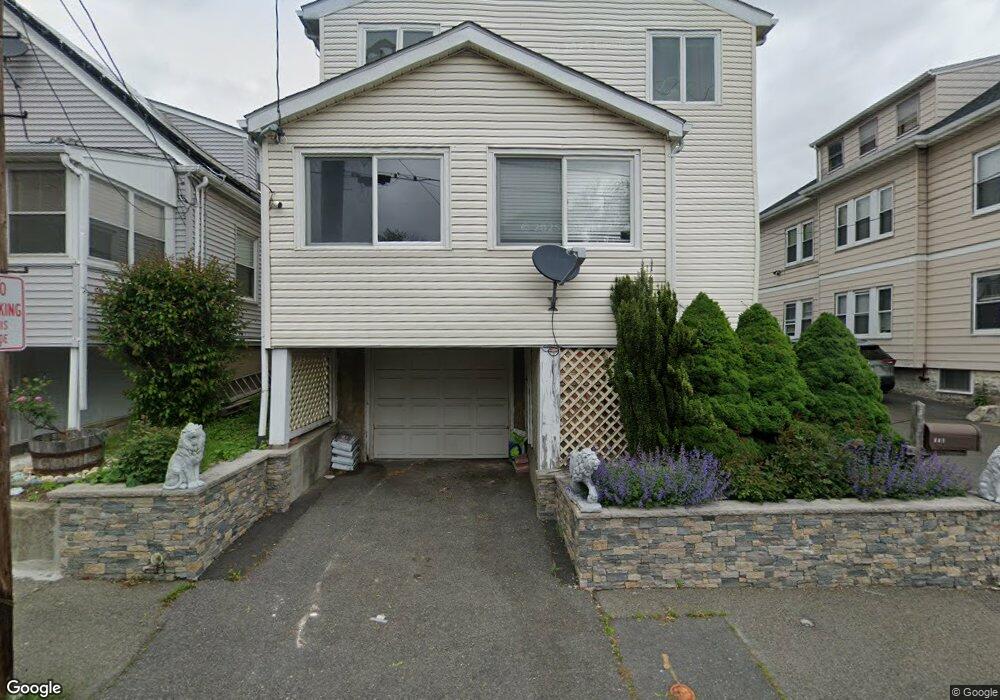
449 Vane St Revere, MA 02151
West Revere NeighborhoodEstimated Value: $711,000 - $799,000
5
Beds
3
Baths
2,184
Sq Ft
$341/Sq Ft
Est. Value
About This Home
This home is located at 449 Vane St, Revere, MA 02151 and is currently estimated at $744,762, approximately $341 per square foot. 449 Vane St is a home located in Suffolk County with nearby schools including Staff Sargent James J. Hill Elementary School, A.C. Whelan Elementary School, and Susan B. Anthony Middle School.
Ownership History
Date
Name
Owned For
Owner Type
Purchase Details
Closed on
Sep 26, 2019
Sold by
Baffo-Folan Nancy D
Bought by
Tejada-Portillo Portillo-Maldonado J and Tejada-Portillo Maria E
Current Estimated Value
Home Financials for this Owner
Home Financials are based on the most recent Mortgage that was taken out on this home.
Original Mortgage
$491,818
Outstanding Balance
$431,735
Interest Rate
3.6%
Mortgage Type
FHA
Estimated Equity
$313,027
Purchase Details
Closed on
Oct 31, 2016
Sold by
Folan William J
Bought by
Folan Nancy D
Purchase Details
Closed on
Jun 23, 1989
Sold by
Mauro George E Est
Bought by
Folan William J
Home Financials for this Owner
Home Financials are based on the most recent Mortgage that was taken out on this home.
Original Mortgage
$90,000
Interest Rate
10.39%
Create a Home Valuation Report for This Property
The Home Valuation Report is an in-depth analysis detailing your home's value as well as a comparison with similar homes in the area
Home Values in the Area
Average Home Value in this Area
Purchase History
| Date | Buyer | Sale Price | Title Company |
|---|---|---|---|
| Tejada-Portillo Portillo-Maldonado J | $530,000 | -- | |
| Tejada-Portillo Portillo-Maldonado J | $530,000 | -- | |
| Tejada-Portillo Portillo-Maldonado J | $530,000 | -- | |
| Folan Nancy D | $175,000 | -- | |
| Folan Nancy D | $175,000 | -- | |
| Folan Nancy D | $175,000 | -- | |
| Folan William J | $140,000 | -- |
Source: Public Records
Mortgage History
| Date | Status | Borrower | Loan Amount |
|---|---|---|---|
| Open | Tejada-Portillo Portillo-Maldonado J | $491,818 | |
| Closed | Tejada-Portillo Portillo-Maldonado J | $491,818 | |
| Previous Owner | Folan William J | $89,000 | |
| Previous Owner | Folan William J | $90,000 | |
| Previous Owner | Folan William J | $90,000 |
Source: Public Records
Tax History Compared to Growth
Tax History
| Year | Tax Paid | Tax Assessment Tax Assessment Total Assessment is a certain percentage of the fair market value that is determined by local assessors to be the total taxable value of land and additions on the property. | Land | Improvement |
|---|---|---|---|---|
| 2025 | $6,085 | $670,900 | $285,200 | $385,700 |
| 2024 | $5,911 | $648,800 | $269,400 | $379,400 |
| 2023 | $5,658 | $595,000 | $225,000 | $370,000 |
| 2022 | $5,583 | $536,800 | $213,900 | $322,900 |
| 2021 | $5,346 | $483,400 | $198,100 | $285,300 |
| 2020 | $5,443 | $483,400 | $198,100 | $285,300 |
| 2019 | $5,279 | $435,900 | $180,600 | $255,300 |
| 2018 | $5,057 | $390,200 | $163,200 | $227,000 |
| 2017 | $4,845 | $346,300 | $142,600 | $203,700 |
| 2016 | $4,422 | $306,000 | $129,900 | $176,100 |
| 2015 | $4,529 | $306,000 | $129,900 | $176,100 |
Source: Public Records
Map
Nearby Homes
- 89 Dale St
- 130 Dale St
- 69 Haskell Ave
- 476 Prospect Ave
- 528 Proctor Ave
- 34 Jarvis St
- 36 S Irving St
- 101 Springvale Ave
- 50 Genesee St
- 39 Cook Ave Unit 2
- 93 Dartmouth St
- 16 Woodside Ave
- 505 Washington Ave Unit 42
- 174 Elm St Unit 1
- 60 Essex St
- 23 Essex St
- 14 Clay Ave
- 469 Washington Ave Unit B
- 10 Clay Ave
- 262 Park Ave